He included this graph from Calculated Risk.

Graph 1. U.S. Vehicle Miles
The number of miles driven tends to flatten during a recession, then recover quickly when the recession is over. At least, that's the way it used to be. The Miles Driven curve seems to have been losing slope since the late 90's, and was close to flat-line during the housing bubble last decade, when everyone supposedly felt rich. There has been no recovery after the recent Great Recession, which officially ended 32 months ago.
The same CR post cited above also includes this graph.

Graph 2. YoY Change in Vehicle Miles
This confirms my eye-ball assessment that the slope in the first graph has been in decline since long before the oil price bubble of recent years.
But here is a contrary development. Calculated Risk also reports that the truck tonnage index is way up for all of 2011, and especially in December, when it posted an all time high.

Graph 3. Truck Tonnage Index
Truck traffic is way up, but total miles driven, per graph 2, has been mostly in decline for four years.
This suggests that discretionary personal driving has been sharply curtailed. I'm having a hard time coming up with any alternative explanation. Can anybody suggest one?
Just in the last couple of months, it seems that discretionary driving has taken a deep plunge that has not yet shown up in the data posted above. Deliveries to retail gas stations have been slumping for well over a decade, and now have fallen off a cliff. If gasoline delivery is just-in-time, as I believe it is, then deliveries are an excellent proxy for consumption.
By the Way, improved fuel economy cannot account for more than a small fraction of this change. The big improvements in fuel economy happened during the 80's, when fuel deliveries were in an upswing. Since 1990, fuel economy improvements for the actual fleet on the road have been on the order of 0.5% per year.
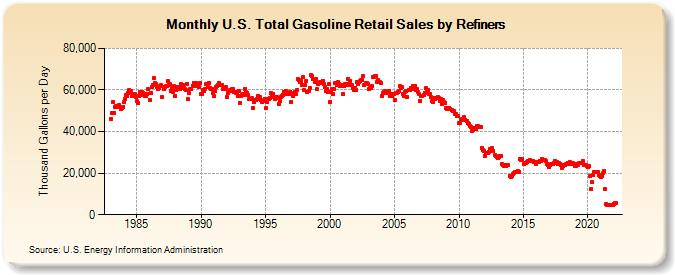
Graph 4. Gasoline Retail Deliveries
I made my own graphs of the retail delivery data (not posted,) and there is, surprisingly, no particular response to the recessions of 1991 and 2001. It's not easy to find any recession on Graph 4. Deliveries were slumping even before the Great Recession, so whatever effect it might have had on its own was subsumed by the general trend. The above graph is noisy, due to lack of seasonal adjustment. The lowest row of dots over most of this graph represents January data. Summer months cluster at the top of the array, as you would expect. Those two lonely points in the lower right corner are October and November, 2011, the most recent data shown.
It's remarkable that gasoline deliveries are now substantially lower than at any time available in this data set. spanning about 30 years. And I would never have guessed that anything like this was happening, based on my many trips on I-75 between Detroit and Toledo. That route must not be a representative sample.
In a comment on Karl's post, I said that I see all petroleum prices as highly manipulated on the supply side, with demand as a follower. This data makes me think that the same is true of gasoline, in particular. But it can't be the entire story for the decline in consumption. There is no clear connection between deliveries and gasoline prices over the last several years.
I don't know where gasoline prices are going. Karl might be right that they are going up. But I don't see any way that this can be due to a demand pull.
Mish also has a couple of recent posts relevant to this topic.
H/T to commentor rjs at Karl's post, who got me thinking about this, and provided a key link.
Cross-posted at Angry Bear.
Update: This post got picked up by Seeking Alpha.
![[Most Recent Quotes from www.kitco.com]](https://lh3.googleusercontent.com/blogger_img_proxy/AEn0k_uH5U4jbH_bCbd8DPlPVbUOC7lS9nUPXNtpmHZEozmBdK3ClJ6jYf8-UfLAQ2IqZh2DLUrmrRy2XJT01UUNIpymxz_AUyf5UcN57yV3fCHz0Lx-vMx27r03cd_OlznBXbjc=s0-d)


6 comments:
"Karl might be right that they are going up. But I don't see any way that this can be due to a demand pull."
Exactly.
Gas prices go up. People stay home. Money saved is spent at Amazon.com. Trucks bring goods to homes. Shopping malls lay off more workers. Recession strikes again. Nobody sees it coming.
Just a theory of course.
ferragamo belts
lebron 17 shoes
supreme clothing
nike air max 90
kd shoes
kyrie 5
moncler jacket
steph curry shoes
golden goose outlet
kyrie 3
go to this site replica bags china click to investigate 7a replica bags wholesale over at this website replica designer backpacks
article good quality replica bags look at this web-site replica gucci bags here are the findings Louis Vuitton Dolabuy
supreme new york
supreme new york
kyrie 6 shoes
yeezy 700
kd 15
off white nike
fear of god
off white shoes
supreme shirt
off white nike
Post a Comment