Monday, Sept 21, 2020
Red Arrow Down
DJI30 at the close —- 27,147.70 -509.72 (-1.84%)
The index opened at 27485, off 173 points. That was the day’s hi. There was an immediate drop to 27165, off 492. By 11:30 it reached the day’s lo of 26715, a stunning loss of 942 points in a little over 2 hours. From there it galumphed along, staying under 26870 until after 3:00 when it climbed up 178 points to the close.
From Friday’s hi of 27945 to today’s lo of 26715 is 1232 points. The day’s span is 770 points.
I’m not a great Elliott wave reader, but this is how it looks to me. The drop from the 9/03 hi to the 9 /11 low was 1751 points. This was wave 1 down at some level of trend. The 9/16 hi was the top of a wave 2 recovery of [amazingly] 916 [!] points. This exceeded the 50% retracement level by 41 points, or 0.14%. How much accuracy do we need? Wave 3 down is now in progress. It is never the smallest, and is often the largest. So it will span more than 1751 points. A target magnitude of 1.382 x 1751 = 2420, landing at 25945 is not unreasonable. However, it could be much lower. After that comes another recovery in wave 4, then wave 5 down to a longer term lo.
If that holds, a wave 4 retirement of 50% would top out at 27155. Then if wave 5 = wave 1, then the lo would be at 25403. The net drop from the 9/03 hi of 29199 would be 3796 points. This is all speculative, and probably optimistic.
The main indexes were all in the red all day. The SP500 had a similar contour to the DJI, and finished off 1.16%. The NASDAQ was down early, but finished strong to only be off 0.13%. The Russell 2000 took a real beating. It fell hard early, then was flat most of the day, finishing off 3.35%.
On Thursday I said this about the indexes, “if the fragmentation resolves into coordinated downward motion, the results could be painful.” i also said a DJI break below 27000 would confirm a downward trend. It finished 148 points above that benchmark, but was almost 300 under at the low. I suspect the partial recovery in the late afternoon is a counter-current sub-wave, and the decline will continue tomorrow or Wednesday. If I’m correct, this would be a 3rd wave of a 3rd wave, and those declines are brutal. Back in March - not so very long ago - it bottomed just above 18000.
Closings -
9/21/18 - 26744
1/02/20 - 28869
8/21/20 - 27930
9/21/20 - 27148
NYSE Internals -
A/D = 443/2623 = 0.17
A/D Vol = 0.12
New Hi/Lo = 19/41 = 0.45
Tuesday, September 22, 2020
Yellow Arrow Sideways
DJI30 Index at the close —- 27,288.18 +140.48 (+0.52%)
The Index opened at 27170, up 23 points, and quickly rose to 27287, up 139. But before 10:00 it fell to 27097, off 50 points. But 10:30 it was back up to 27220, but 20 minutes later had fallen to 27095 and hit the day’s lo at 26990 at 11:00. I climbed the rest of the day, hitting the hi of 27333 at 3:45 before sliding 55 points into the close. The span was 343 points - less than half of yesterday’s 770.
The hi and close wound up close to the 55 day EMA at 27355. It looks as if my suspicion that there is support in the lo 2700’s is bearing out.The EMA dropped by 8 points today. It hasn’t had a drop since 6/29. The last time before then was on 5/18.
This is an inside day. The close is up 140 points, but the hi is lower by 152. An inside day is no surprise if the Index is, as I suspect, in counter-current sub wave 2 of a downward thrust. If sub wave 1 was the 1650 point loss from the 9/16 hi to yesterday’s lo, the increase to today’s hi is 618 points, a .375 retracement, and only 12 points under
the .382 retracement level at 27345.
The minimum expected level was reached with today’s hi. It’s possible to go to higher retracement levels at .50 or .618, so there might be a further increase tomorrow. But if my assessment is correct, the Index will soon turn down again in dramatic fashion.
Closings -
9/21/18 - 26744
1/02/20 - 28869
8/21/20 - 27930
9/22/20 - 27288
NYSE internals -
A/D = 1710/1321 = 1.29
A/D Vol = 1.08
New Hi/Lo = 30/26 = 1.15
Wednesday, September 23, 2020
Red Arrow Down
DJI30 Index at the close —- 26,763.13-525.05 (-1.92%)
The index opened at 27414, up 125 points. It reached the day’s hi of 27464 in a few minutes, then tumbled to a lo of 27153 at noon. It ran more or less sideways until 1:30, then took a serious fall, bottoming at 26716 about 7 minutes before the close. The span was 748 points.
Today’s hi was a 45.4% retracement of the 9/16 to 9/21 decline. It’s 76 points short of a 50% retracement, but I don’t think we’ll see that. This is an outside day compared to yesterday, but is inside of Monday’s 770 point span - by 51 points at the hi end, and only one point above at the low. But the close is 385 points under Monday’s. While it’s possible to go back up from here, I think the decline is now in full force.
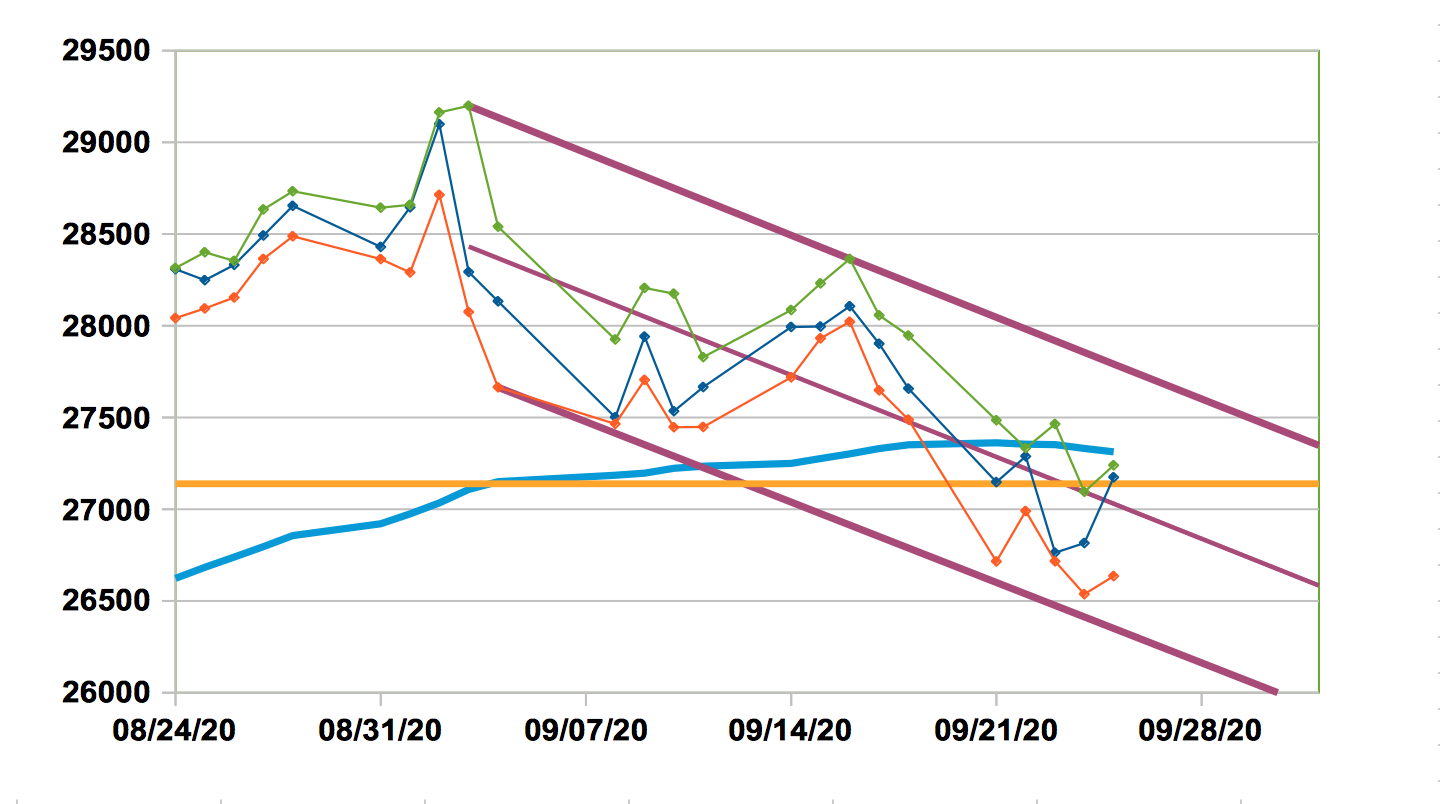
I mentioned a support/resistance level in the low 27000’s. Unless there is a sharp rebound tomorrow, this support has been breached. On the chart, 27500 is indicated with a red line. It was round number resistance in early June, support from mid-August through mid-September, and resistance again today. The orange line is the .786 retracement and the blue line is the .618 retracement, both from the 3/23 lo. There could be support and/or resistance at those levels. Both 26000 and 25000 could offer round number support. From mid-June to mid-July the 26000 level was magnetic.
We’re in for a bumpy ride. The other indexes were all down by greater margins: SP500 - 2.37%; NASDAQ - 3.02%; Russell 2000 - 3.04%. The next few weeks could be brutal.
Closings -
9/21/18 - 26744
1/02/20 - 28869
8/21/20 - 27930
9/23/20 - 26763
NYSE Internals - The A/D ratio is the lowest since 4/01, a few days after the 3/23 lo. A/D Volume is the lowest since 5/13 when there was a 517 point loss in the DJI. The new Hi/Lo ratio was lower on Monday, when the DJI lost 510 points; before that it was 5/14.
A/D = 310/2757 = 0.11.
A/D Vol = 0.11
New Hi/Lo = 28/54 = 0,52
Thursday, 9/24/20
Yellow Arrow Sideways
DJI30 at the close —- 26,815.44 +52.31 (+0.20%)
The Index opened at 26716, off 47 points, and within 5 minutes fell to the day’s lo 26537, off 226. It immediately rebounded to reach 26740 - all before 10:00. It fell to 26650 at 10:45, then jaggedly climbed to the hi of 27094, up 332 points at 1:30, followed by an equally jagged 279 point fall into the close. The lo to hi span was 558 points.
Actually, calling today’s action sideways might be generous. First, a 0.2% move is almost no move at all. Then, contrasting the small gain at the close, the hi was 370 points under yesterday’s and the lo was lower by 179. I might be out on a limb here, but my guess is that the increase to today’s hi was a counter-current move two levels of trend below the main thrust - which is down from the 9/03 hi.
Momentum is clearly down now, and I anticipate a further drop tomorrow.
Closings -
9/24/18 - 26562 [does anybody else love palindromes?]
1/02/20 - 28869
8/24/20 - 28042
9/24/20 - 26537
NYSE Internals - The new Hi/Lo ratio hasn’t been this lo since April 2.
A/D = 1497/1532 = 0.98
A/D Vol = 1.39
New Hi/Lo = 9/72 = 0.125
Friday, September 25, 2020
Daily Arrow Green - Up
Weekly Arrow Yellow - Sideways
DJI30 Index at the close —- 27,173.96 +358.52 (+1.34%)
The Index opened at 26695, off 121 points. A few minutes later, it briefly touched 26817, up 2. Before 10:15 if dropped to 26635, off 180. There was an immediate rebound to 26930, up 114 at 10:45. It ran sideways for a couple hours, then turned strongly upward, reaching the hi of 27239 just 45 minutes before the close. The lo to hi span was 604 points.
This is a clearly up day, but the hi and lo were only up by 144 and 98 points, respectively, much less than the closing increase. Plus, the hi and close are under Tuesday’s. So in the context of the week, the motion is sideways. This still looks counter-current. A continuos rise above 27500 would cast doubt on this idea.
The hi and close are near the orange line at 27139, representing the .786 retracement from the 3/23 lo. The 55 day EMA, at 27313 and falling, is only slightly above these values. I’ve mentioned support/resistance in the lo 27000’s, and we see it playing out now.
All the indexes were up; the others by higher percentages than the DJI. I wasn’t expecting an increase today. But, longer term, I think the momentum is down and we’ll see further losses next week. I’ve drawn a new down-slanting channel to reflect recent action. Monday’s and Thursday’s lows approached the bottom and the index then rose away from it. There’s room for continued sideways motion within the channel, and we might see some more of that. But I think the downward trend is pretty well established.
Closings -
9/25/18 - 26492
1/02/20 - 28868
8/25/20 - 28248
9/25/20 - 27174
NYSE internals -
A/D = 2164/831 = 2.54
A/D Vol = 1.98
New Hi/Lo = 16/25 = 0.62
![[Most Recent Quotes from www.kitco.com]](https://lh3.googleusercontent.com/blogger_img_proxy/AEn0k_uiL92G0D7bCIElh9ggq5hRzIPw7mHsw1C_XE-SCFuHgmm7zkxjInONFYpyu6wPrlx20X8ixcvJcv-r_8QDUz-IVux4XPoTKXU0x_gBFr0swsYrxgjaW5bhtby4GSzvQa7I=s0-d)


No comments:
Post a Comment