Look: I am eager to learn stuff I don't know--which requires actively courting and posting smart disagreement.

But as you will understand, I don't like to post things that mischaracterize and are aimed to mislead.

-- Brad Delong

Copyright Notice

Everything that appears on this blog is the copyrighted property of somebody. Often, but not always, that somebody is me. For things that are not mine, I either have obtained permission, or claim fair use. Feel free to quote me, but attribute, please. My photos and poetry are dear to my heart, and may not be used without permission. Ditto, my other intellectual property, such as charts and graphs. I'm probably willing to share. Let's talk. Violators will be damned for all eternity to the circle of hell populated by Rosanne Barr, Mrs Miller [look her up], and trombonists who are unable play in tune. You cannot possibly imagine the agony. If you have a question, email me: jazzbumpa@gmail.com. I'll answer when I feel like it. Cheers!

Sunday, January 7, 2024

NVIDIA Revisited

 On August 26, 2023, 5 days before it a new closing hi at 493.55, I wrote a critical post about NVDA - the stock, not the company.   After that, the stock took a nose dive, falling 16.9% to 410.17 on 9/26/23.  That would have been a good buying opportunity of you were an agile trader or had a strong stomach.  After rising to 469 on 10/12/23, it fell to a new lo at 405 on 10/27/23.  But it bounced quickly, reaching a marginal new high at 496.56 on 11/14/23.  In the 2 months since, it's wobbled a bit, going nowhere, to close at 490.97 on 1/05/24.  Actually, the stock has been in the doldrums for 4 1/2 months, and pays no dividend.  See Graph 1.  

Graph 1

Per Yahoo finance, the current P/E is a wildly unsustainable 64.94.  But never underestimate the irrationality of the market.

Over a 24 month span the stock is up 80%, while the NASDAQ is off almost 3%.  This, I believe emphasizes the unsustainability of the stock price.  See graph 2.

Graph 2 - source: Yahoo Finance

The difficulty in this kind of a situation is that the stock might have peaked, or it might just be building a base for a new advance.  If I owned this stock [I do not] I wouldn't be in a big hurry to sell it all, but I would be watching carefully for the signs of a likely, possibly even inevitable, collapse.  It's happened before - in 2022 it dropped 66%.  Since August of 2023 it's been distressingly volatile, while not advancing.  So I might consider selling some to lock in a hefty profit. But if the 5 day EMA drops below 162, and keeps heading down, I'd dump it.  See Graph 3.

Graph 3

Disclaimer - I am not a financial or investment advisor.  I do these mental speculations for my own amusement and edification.  Make your own decisions and chose wisely.  Which is pretty damned difficult.

Note: Graphs 1 and 3 are from my files.

Thursday, October 19, 2023

Saturday, August 26, 2023

Some Thought on Nvidia

 This week, NVDA wildly exceeded revenue guidance, posting $13.5 Billion vs the expected $11 Billion, an increase of 101% over the same quarter last year.  Impressive - no?

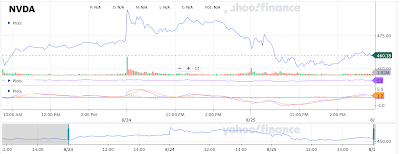
On Thursday, the stock hit a new intraday hi of 502.66 just after the opening, but then fell the rest of the day, losing 31 points and closing at 471.63, a fraction above the day's lo.  [Graph 1, From Yahoo Finance.]


Graph 1 NVDA 8/23 to 8/25

The most recent new closing high was 474.94 on 7/18, more than a month ago.  

Here's a hard and unpleasant fact: even with this earnings blow out, the P/E ratio is 110.89.  Will you scoff at me if I suggest that this is not sustainable?  And the lack of a new closing high after this earnings report is not a good sign.  Further, Friday's close was off 11.45 points, or 2.43%.  I wonder - at this level, are there many buyers left?

Let's take a look from a longer view. Graph 2 shows daily closings from the middle of last year, along with trend lines and exponential moving averages.  [Data source - Yahoo Finance]

Graph 2  NVDA Closings from mid 2022.

Like just about everything else, NVDA dropped dramatically through the first 9 months of 2022.  From the hi of 336.71 on 11/29/21 it slumped to a low of 112.27 on 10/14/22, a staggering loss of 66.36%. Then, at the end of the year, there was a higher lo, suggesting that the drop might be complete.  This became an even stronger suggestion when the price crossed over the descending trend line [in violet] a few weeks later.  From there it was up, up and away until the recent all time highs.

 On 5/24/23 the stock rose 24.4% in a single day, and kept climbing for almost 2 more months.  This leap carried the price far above the green up-slanting trend line, and this is what irrational exuberance looks like.

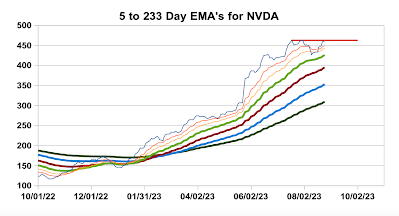
Graph 3 is a look at exponential moving averages of daily closings, from 5 day to 233 day periods.

Graph 3 Exponential Moving Averages 

The thin blue line is the 5 day EMA.  It is more volatile and quicker moving than the longer EMAs.  After its low of 116.83 on 10/14/22 the next intermediate low was 145.29 on 1/04/23. This also suggests that the bottom was in.  This was confirmed by the cluster of long EMA lines in Early February.  From Feb 1 to 21 the stock bounced around in the 210 to 220 range while all the EMA's continued rising. 

All the long EMAs [55 to 233 day] continued rising right through 8/25/23, but the shorter ones have faltered.  The 5 EMA line hit 462.9 on 7/19 then topped at 463 on 8/01, indicated on Graph 3 with the red horizontal line.  It got close again on 8/24 and 8/25, but stalled under 462. 

This looks to me like topping action.  If 463 turns out to be a hard resistance line, then NVDA is going to falter.  Right now it's hovering in tulip bulb territory, and a crash could be brutal.

If the P/E were to revert to a much more reasonable level of 30, for instance, the price would have to drop to about 125, for a loss of 73 percent from the 8/25 close of 460.18.

For comparison, Alphabet [GOOG] has a P/E of 27.57; Apple [APPL] is at 29.92; and Microsoft [MSFT] is at 32.46.

There's a lot of "if" here, and I don't have a crystal ball.  The recent stall might be a pause to consolidate before the stock price doubles again. The market can stay irrational longer than most of us can stay solvent.  NVDA ia a great company; but at these prices, I don't think it's a great stock. 

EDIT

Here is an interesting insight, for what its worth.


Source:

https://twitter.com/JaguarAnalytics/status/1695109989663219925


Monday, September 19, 2022

Taking Stock - Sept 20, 2022

The Indexes stayed close to the neutral point for most of the day, then turned up before 3:00. The SP 500 finished at 3899.99,, less than a point below the late day hi, for a gain of 26.66 [0.69%.]
This week the Fed will have a two day meeting to set policy. Another rate increase of 0.75% or more is expected. This is not surprising, since, as I pointed out on Sept 1, the Fed is far behind the market-set 3 month T-Bill rate. [Link below]
There is no surprise here, so It could be that the anticipated increase is already baked into the market's reaction - if that even matters.
Meanwhile, the Index is hovering near the last reasonable retracement level from the 8/16 hi, coincidentally located in the midst of a broad support/resistance range between 3700 and 3900.
For what it's worth, the day's hi and lo were both marginally above those of Friday's session. You find whatever positives you can.


Saturday, September 17, 2022

Taking Stock

After 4 up days ending in a gain of 5.15%, I was not surprised to see a pull back in the SP500 on Tuesday.  But I was astounded by the magnitude, and then the follow-through.  At Friday's lo, 3837.08, the index was almost 14 points [0.36%] under 3850.76.

This is the .786 retracement level from the 8/16 hi, the last reasonable level to support the current increasingly wobbly bull case.  It's also in the midst of a support/resistence range between 3700 and 3900, dating back to June.

The only slightly bright glimmer I can find is that after hitting the day's lo shortly after noon, the Index rose 36.25 points [0.94%] into the close at 3873.33.  Most of this rise happened after 2:30 p.m.

If the index continues falling next week, then the 6/17 lo is at risk.  Then, if that is breached, The Index could reach as lo as 3200.


Thursday, September 1, 2022

Fed, Schmed

It seems the Fed likes to keep the Federal Funds rate slightly above the 3 month T-Bill rate.  

But the FFR almost always follows the T-Bill rate, and almost never leads.  

Right now it is lagging, and that might be why pundits are expecting another .75% increase in September.


Wednesday, August 24, 2022

Taking Stock - Tuesday, August 23, 2022 [with updates]

Let's assume that the 6/16 lo in the SP500 index at 3636.87 was the end of a corrective wave from the 1/03 all time high, and that the action since is the beginning of the next impulse wave up to new higher highs.
To confirm this notion will requite identifying a five wave form up from the 6/16 lo. If so, then wave 1 up was a gain of 308.99 points to a local hi at 3945.86 on 6/28. Wave 2 down followed the typical 3 sub-wave down-up-down pattern to a local lo at 3790.38 on 7/14, a retracement of 50.8%.
Then, wave three up terminated at the local hi at 4325.28 on 8/16, and the index is now in wave 4 down.
Retracements are frequently at or near 38.2; 50, or 61.8% of the previous move. The resulting values would be 4120.95; 4057.83; and 3994.71, respectively - indicated with red lines on the chart..
Today's session was almost flat, and the lo at 4129.86 is within 9 points of the 38.2% retracement level.
On the way up in wave 3, the index stalled in a range near 4178 [heavy blue line] a resistance level extending back to March, 2021, when the index was on its way up to the all time hi. Coincidentally, the 144 day exponential moving average [dark purple curve on the graph] is moving through that same range and can contribute to either resistance or support.
On the graph, daily highs are connected with a thin green line, lows in red, and closings in blue. The highs and lows are used In this analysis.
There are three possibilities at this point.
1 - The index is close to completing wave 4 down, and will soon move into wave 5 up, extending beyond the wave 3 hi at 4325.28.
2 - There will be a deeper retracement, probably to another of the typical levels, followed by wave 5 up.
3 - This entire analysis is wrong, and the index will continue to fall below 3636 to new lows.
I think 3 is the least likely, but the picture should clarify over the next several days.


Update - Thursday 8/25

Yesterday's SP500 lo at 4119.97 is within a single point of the .382 retracement level at 4120.85 that I mentioned on Tuesday.
This might just be a coincidence. But if the index climbs from there to close above the 8/16 hi at 4325.28, that will increase confidence that wave 4 is complete, and that wave 5 will continue up to at least 4430 [heavy green line on the chart] and possibly as high as 4650, before the next corrective wave.
Today, it finished at 4200.54, Marginally above the blue line at 4176 - a support/resistance level dating back to April, '21. If it falls back down again, wave 4 is probably still unfolding.


Update Friday 8/26

The market took a hard turn to the downside today.  I mentioned this possibility yesterday, but did not expect it, and certainly not at this magnitude.  The SP500 did a brief zig-zag in the first half hour,  dropped in the next half hour, then slid the rest of the day to finish at the lo.
The lo, 4057.66, is within 34 points of the 50% retracement level at 4023.52.  The chart shows all of wave 3 and the unfolding wave 4
Yesterday, the index peeked above the support/resistance level at 4178, but it could not hold.  This resistance is proving to be more formidable than I thought.
This could still be corrective wave 4, and that will remains my opinion until proven otherwise.  A drop under the 7/17 lo will make this position hard to justify, and a further drop below the 6/16 lo at 3636.87 will negate it completely.
We'll see how it plays out over the next several days.


Tuesday, January 11, 2022

Taking Stock - week of January 10, 2022

Monday, January 10, 2022

SP500 at the close ---   4,670.29   -6.74 (-0.14%)

DJI30 ---   36,068.87   -162.79 (-0.45%)

NASDAQ ---   14,942.83   +6.93 (+0.05%)

Russell 2000 ---   2,171.15   -8.66 (-0.40%)

The SP500 started negative, took a deep dive to 4582, the lo, off 95, before 11:00; and, coincidentally, 95 points below the critical support level. But it recovered the rest of the day, and finished with only a small loss.   

The DJI opened at 36175, the hi, off 56 points.  It dropped to 35640, the lo, off a stunning 592 points before 11:00.  From there it also recovered, finishing with a moderate loss. 

An encouraging point is that both of these indexes finished on up-ticks and volume surges.

The NASDAQ opened at 14752, off 184 points, and dropped to 14530, its lo, before 11:00.  It rose the rest of the day to finish at its high for a minuscule gain.

The Russell opened flat at the day's hi, and dropped near 2133, the lo, before 11:00.  After a slight rise it fell again, hitting the lo, off 45 points, before 1:00.  From there it rose into the close, finishing with a moderate loss.

All the indexes followed similar paths with deep declines in the morning and strong recoveries later in the day, mostly for losses.  If the upward momentum can continue tomorrow, this could be the end of the decline.  But that is no sure thing, so we'll have to wait and see.


Tuesday, January 11, 2021

SP500 at the close ---   4,713.07   +42.78 (+0.92%)

DJI30 ---   36,252.02   +183.15 (+0.51%)

NASDAQ ---   15,153.45   +210.62 (+1.41%)

Russell 2000 ---   2,194.00   +22.85 (+1.05%)

The SP500 opened at 2669, off a point, and fell to 4638, the lo, before 10:00.  Before 11:00 it started rising, and ran sideways for the last hour, and closed 1 point under the hi for a substantial gain.

The DJI opened at 36059, off 10, and fell to 35769, the lo, off 299 before 10:00.  It then climbed, hitting 36271, the hi, after 3:00, then slid about 30 points into the close for a moderate gain. 

The NASDAQ opened at 1419, off 24 points. It dropped to 14838, the lo, off 105 at 9:45.  It climbed until noon, then ran mostly sideways into the close, finishing with a large gain.

The Russell opened flat at 2171.  It fell to 2155, the lo, off 16 points.  It reached 2193 after 2:00, and then ran sideways into the close for a substantial gain.  

All the indexes dropped early, then recovered hitting their highs in the afternoon – when motions were more or less flat.  Clearly, recent days have been a time of above normal volatility, and that might not end any time soon.

Hang on to your hats, the ride could get thrilling.


Wednesday, January 12, 2021

SP500 at the close ---   4,726.35   +13.28 (+0.28%)

DJI30 ---   36,290.32   +38.30 (+0.11%)

NASDAQ ---   15,188.39   +34.94 (+0.23%)

Russell 2000 ---   2,176.06   -17.95 (-0.82%)

The SP500 opened at 4729, up 16 points.  It rose to 4749, the hi, up 36, at 10:45, and dropped to 4707, the lo, at 11:15.  The rest of the day it chopped mostly sideways around 4720 and concluded with a small drop on a volume surge, ending with a small gain.

The DJI30 opened at 36336, up 84 points.  It reached 36453, the hi, up 201, then fell to 36168, off 84.  It chopped around the rest of the day, dropping slightly below neutral a couple more times.  At the end, it slid a few points into the close on a volume surge.

The NASDAQ opened at 15263, up 110.  It reached the hi, 15319, at 9:45, then dropped to the lo, 15117, between 11:00 and 11:30.  The rest of the day was mostly sideways and slightly positive, ending with a slight gain.

The Russell 2000 opened at 2195, up less than a point.  It reached 2210, the hi, at 10:00, then fell to, 2169, the lo, at 11:15.  It spent the rest of the day in the red, and finished with a substantial loss.

The other 3 indexes were positive to small extents.  The Russell is often an outlier, but represents a far greater number of issues.  And even in that case, the day's hi and lo are both higher, so the span moved up, though the close was down.  So this day is inconclusive.  I hope.


Thursday, January 13, 2021

SP500 at the close ---   4,659.03   -67.32 (-1.42%)

DJI30 ---   36,113.62   -176.70 (-0.49%)

NASDAQ ---   14,806.81   -381.58 (-2.51%)

Russell 2000 ---   2,159.44-16.62 (-0.76%)

The SP500 opened at 4733, up 7 points.  It reached 4744, up 18 points, at 10:00, then fell the rest of the day.  It hit, 5650, the lo, just moments before, and 9 points below the close.  It finished with a large loss.

The DJI 30 opened at 36312, up 22.   It hovered near 36514, up 224 from 11:30 until noon.  It fell in 2 steps to 36044, the lo, moments before and 69 points under the close.  It finished with a moderate loss.

The NASDAQ opened at 15245, up 57, and reached 15260, the hi, before 10:00.  It fell in 3 steps, reaching 14782, the lo, a few minutes before and 25 points below the close.  It finished with a unusually large loss.

The Russell 2000 opened at 2177, up a point.  I reached 2197, the hi, at 10:00.  This was the first and highest of three peaks in the roller-coaster ride to the bottom.  This occurred minutes before and 5 points below the close.  It finished with a substantial loss.  It sits now at a support level extending back a year.


Friday, January 14, 2021

SP500 at the close ---   4,662.85   +3.82 (+0.08%)

DJI30 ---   35,911.80   -201.79 (-0.56%)

NASDAQ ---   14,893.80   +86.95 (+0.59%)

Russell 2000 ---   2,162.46   +3.02 (+0.14%)

The SP500 opened at 4636, off 21 points. It rose close to the day's hi before 10:30, but fell back to 4615, the lo, before 1:30.  It then rose again, hitting 4665, the hi, just before closing about 2 points lower, for a minuscule gain.

I've added a lower trend line to the chart, starting at 10/4/21.  The index might be tracing an ending diagonal.  If correct, there could be a blow off ending, followed by a sharp decline.  We'll have to see how this plays out.

The DJI30 opened at 35996, the day's hi, off 117.  It dropped to 35641, the lo, off 472, before 1:30.  It then rose
to 35935 moments before the close, 23 points lower, for a modest loss.

The NASDAQ opened at 14708, off 99 points.  It rose to 14888, near the hi, before 9:30, then dropped, hitting 14689, the lo, off 117 before 1:30.  From there it rose again, reaching 14898, the hi, moments before the close, for a modest gain.

The Russell 2000 opened at 2158, off a point.  It reached 2156, off 3, before 10:30.  It fell, hovering near  2126, the lo, around 1:30. It then climbed steadily to close at the hi for a small gain.

The indexes all had roughly similar contours, but with different magnitudes at different levels. Diversity in unity, I guess.  Though I may have that backwards.

Weekly changes -
SP500  -0.30%
DJI30  -0.88%
NASDAQ  -0.28%
Russell 2000  -0.80%


Monday, January 3, 2022

Monday, December 31, 2022

Green Arrow Up

SP500 at the close ---  4,796.56   +30.38 (+0.64%)

DJI30 --- 36,585.06   +246.76 (+0.68%)

NASDAQ --- 15,832.80   +187.83 (+1.20%)

Russell 2000 --- 2,272.56   +27.24 (+1.21%)

The SP500 opened at 4778, up 12 points, and after a rise dropped quickly, hitting 4758, the lo, before 10:00.  It stayed below 4786 until 2:00, then rose to close within a fraction of the late day hi, for a solid gain. It achieved a new closing hi, but not a new intra-day hi. This is an outside day, with the hi higher by 10 points and the lo lower by 7.  The index is still stalled near 4788, the critical resistance level identified last week.

The DJI30 opened at 36322, off 17.  It first rose, then fell to 36246, the lo, off 92, before 10:00.  It stayed below 36495 until 2:00, then rose closing within a point of the late day hi, for a solid gain.  It also achieved a new closing hi but not a new intra-day hi.  It had an outside day, with the hi higher by 11 points, and the lo lower by 58.  it also seems stalled near the earlier highs from November.

The NAQSDAQ opened at 15733, up 88.  After a brief rise it fell to 15644, off a fraction before 10:00.  It stayed below 15785 until after 1:30.  It stepped up to 15820 after 2:30, then went mostly sideways to close at 15832, the hi, for a substantial gain.  It had a higher higher by 55 points, but the bottom was flat.  It remans about 70 ponits under the early November highs.

The Russell 2000 opened at 2247, the lo, up over a point.  It reached 2284, the hi, up 38 at 10:30.  It dropped to 2260 after 11:30, and stayed at that level until after 3:00. After a slight dip it rose into the close, 12 points under the mid-morning hi.  It had a clearly up day by 26 points at the top and 2 at the bottom, and remains about 200 points under the early November highs.

All things considered, this is a pretty good start to the week.  But the situation is still ambiguous.


Tuesday, January 4, 2022

SP500 at the close ---   4,793.54   -3.02 (-0.06%)

DJI30 ---   36,799.65   +214.59 (+0.59%)

NASDAQ ---   15,622.72   -210.08 (-1.33%)

Russell 2000 ---   2,268.87   +23.56 (+1.05%)

The SP500 opened at 4805, up 8 points and rose to 4819, the hi, up 22, before 10:00.  It then fell, hitting 4774, the lo, off 22, at 2:00.  It climbed again, hitting 4807 at 3:50, but then fell 11 points to close with a minute loss, on a volume surge. 

The Index is still hung up near the 4788 critical resistance level. 

The DJI30 opened at 36636, the lo, up 51 points, and hit 36935, the hi, up 350, before 11:00.  It drooped to 36740, up 155 at 2:00, rose to 36890 at 3:50, then dropped 90 points into the close on a volume surge.  Still, the Index achieved a new intra-day hi by 255 points and at the closing by 215. Obviously, this is a clearly up day that spent every moment well into positive territory.  

The NASDAQ opened at 15852, the hi, up 19, but fell to 15538 at 11:00.  It stayed below 15607 until after 3:00, reaching 15512, the lo, off 320, when it had a slight rise, but then fell into the close on a volume surge.  Because of the opening gain this was an outside day, but the lo was lower by 132 points.  

The Russell 2000 opened at 2247, the lo, up 2 points.  It immediately rose to 2288, the hi, up 43.  It then slumped, reaching 2258 after 11:00.  From there it meandered into the close for the day's largest gain.  Th hi was up 4 points, but the lo was dead even with yesterday's.

The indexes were strangely disconnected today, so no general trend can be identified.  I'm taking this to be consistent with the idea that they are experiencing an ongoing corrective wave, against a higher level upward thrust; though the DJI and Russell might be starting the next upward wave.  This is all very uncertain.


Wednesday, January 5, 2022

Red Arrow Down

SP500 at the close ---   4,700.58.  -92.96 (-1.94%)

DJI30 ---   36,407.11   -392.54 (-1.07%)

NASDAQ ---   15,100.17   -522.54 (-3.34%)

Russell 2000 ---   2,194.00   -74.87 (-3.30%)

This was not very good day, right from the beginning.  Then, after 2:00, it got really bad, for all the indexes.  Changes of a percent or so, in either direction, are not uncommon.  Changes of 2 percent are uncommon.  Changes of over 3% are rare.

The SP500 dropped almost 2% today, and is now closer to the critical support level than it is to the critical resistance level I mentioned several times recently.  If that is breached significantly, then the presumed up-trend
is refuted.

Futures are close to flat, but slightly positive as I write this, shortly after 9:00 p.m. EST.  We'll see if that can carry into the next session.


Thursday, January 6, 2022

SP500 at the close ---   4,696.05   -4.53 (-0.10%)

DJI30 ---   36,236.47   -170.64 (-0.47%)

NASDAQ ---   15,080.87   -19.31 (-0.13%)

Russell 2000 ---   2,206.37   +12.37 (+0.56%)

The SP500 opened and closed slightly negative.  In between, it stayed within 25 points above and 29 points below neutral.  It was inconclusive after yesterday's large loss.  At the low it was 6 points under the critical support level at 4617.  A significant breach will suggest further losses.

The DJI 30 opened slightly positive and spiked up 57 points after 12:30.  The rest of the day was spent in the red, ending with a moderate loss.  At the lo, it went slightly under the 144 day EMA.

The NASDAQ opened negative and hit its minimum after 10:00.  I spent most of the day slightly positive, but finished with a small loss. At the lo, it went slightly under the 145 day EMA.

The Russell 2000 opened flat and fell to its lo before 10:30.  It spent the rest of the day positive, and finished with a modest gain.  It spent the day below its moving averages.

The bleeding didn't completely stop today, but it slowed down substantially. The gain in the Russell is hopeful.  Let's hope tomorrow brings a recovery.  


Monday, December 27, 2021

Taking Stock -- Week of December 27, 2021

Monday, December 27, 2021

SP500 at the close ---  4,791.19   +65.40 (+1.38%)

DJI30 --- 36,302.38   +351.82 (+0.98%)

NASDAQ --- 15,871.26   +217.89 (+1.39%)

Russell 2000 --- 2,261.46   +19.89 (+0.89%)

The SP500 opened at 4733, up 8 points, and immediate;y rose to 4750. It then rose more slowly, reaching 4774 at noon and 4784 at 2:30.  After a slight draw back it rose into the late day hi, closing less than a point lower.  Last Thursday the index came within 4 points of a new intra-day hi.  Also on Thursday it reached a new closing hi by 13 points, and today it exceeded that by 65.

Elliott Wave analyst Avi Gilbert identifies 4677 as a critical support level to maintain the short term bullish case.  A significant break of that level means that a corrective phase is unfolding with further declines expected.  He also identifies 4788 [top horizontal line on the graph] as critical resistance.  An impulsive break through suggests further gains ahead.

The DJI30 opened at 35954, up 4 points, and immediately rose to 36077.  It chopped up and down for 45 minutes, then climbed again reaching 36187 at 12:15 and 36265 at 2:30.  After a slump to 36200 after 3:00 it rose sharply to close 4 points under the late day hi.  This index is approaching new highs, but has not yet achieved them.

The NASDAQ opened at 15697, up 43 points, and quickly rose to 15763.  After a brief draw back it climbed to  

155844 at 12:15 and after 2:30.  Following a slump to 15825 before 2:30 it rose to close within a fraction of the day's hi.  It is still 200 to 400 points under recent all time highs.

The Russell 2000 opened at 2242, up a point.  It slumped to 2230, off 11, at 10:00, then quickly rose, reaching 2255 at 11:15.  It ran horizontal above 2250 until after 3:30 when it climbed sharply into the close for the day's largest gain.  It remains about 200 points under the recent all time highs.

This is a nice follow up to last week's gains, and a good start to the week.  Maybe there is a Santa Clause.


Tuesday, December 28, 2021

SP500 at the close ---  4,786.32   -4.87 (-0.10%)

DJI30 --- 36,398.21   +95.83 (+0.26%)

NASDAQ --- 15,781.72   -89.54 (-0.56%)

Russell 2000 --- 2,246.51   -14.95 (-0.66%)

The SP500 opened at 4795, up 4 points.  It reached 4807, the day's hi, before 10:00.  It then dropped the rest of the day in two choppy looking steps, hitting 4780, the lo, at 12:30.  It then wandered into the close for a small loss.

It reached a new intra-day hi, but not a new closing hi, faltering within 10 points of the critical resistance level I mentioned yesterday.  But after 5 strong days, a slight pull back is not a surprise, and does not, on its own, impede the bullish case.

The DJI30 followed a roughly similar path, It opened at 36302, the day's lo, up a fraction, and reached 36527, up 225, the hi, after 10:00.  It also fell in two steps, hitting 36344, an intermediate lo, at 12:30, before chopping into the close for the day's only gain.  It remains about 40 points under all time highs.

The NASDAQ opened at 15895, up 24, and reached 15901, the hi, up 30, at 10:00. It had a bumpy ride down until hitting 15757, the lo, off 114, after 2:00.  From there it was a slight rise and fall into the close.

The Russell 2000 opened at 2261, off a fraction.  It reached 2275, the hi, up 13, at 10:00.  It fell to 2246, the lo, off 16, at 12:30, struggled to reach 2257 at 3:30, then drooped, finishing within a point of the lo for the day's largest loss.

Wednesday December 29, 2021

Yellow Arrow Sideways

SP500 at the close ---  4,793.06   +6.71 (+0.14%)

DJI30 --- 36,488.63   +90.42 (+0.25%)

NASDAQ --- 115,766.22   -15.51 (-0.10%)

Russell 2000 --- 2,249.24   +2.74 (+0.12%)

The SP500 opened at 4789, up 2 points, and dropped to 4778, the lo, off 8 points at 10:15.  It stayed under 4793 until 2:00, and reached 4804, the hi at 3:50, the dropped hard into the close for a small gain. 

The DJI30 opened at 36421, up 23, quickly reached 36509, up 111, then dropped to 36396, off 2, the lo, at 10:15. It stayed below 36509 until 3:00, and reached 46572.the hi at 3:50 before dropping hard into the close for a modest gain.  

The NASDAQ opened at  15795, up 13, and dropped to 15680, off 102 at 10:15.  It then stayed below 15777 until 3:30, hitting 15792 after 3:50, followed by a drop into the close for a small loss. 

The Russell 2000 opened at 2246, off a fraction, and dropped to 2237, off 10, at 10:15. It climbed to 2253, the hi, after 11:00. it snaked around neutral, staying above 2243 the rest of the day, then rising from that level after 3:30 to close with a small gain.

Today's action appears to be counter-current to the presumed short term up trend.  The SP500 has stalled within a few points of 4788, the critical resistance level identified by Avi Gilbert.  Pushing through that level with an impulse will validate the bullish case.


Thursday December 30, 2021

Yellow Arrow Sideways

SP500 at the close ---  4,778.73   -14.33 (-0.30%)

DJI30 --- 36,398.08  -90.55 (-0.25%)

NASDAQ --- 15,741.56   -24.65 (-0.16%)

Russell 2000 --- 2,248.79   -0.45 (-0.02%)

The SP500 opened at 4794, up 1.  It reached 4809, up 16, the hi, before 10:30.  It drifted slowly lower until 3:30, when it fell sharply, hitting 4775, the low, just 3 minutes before the close.  The 3 point rise at the end came on a volume surge.

The index remains stalled near the critical resistance level of 4788.  It did reach a new intra-day hi by less than 2 points, but missed a closing hi by 12.

The DJI30 36522, up 34, and quickly rose to 36679, up 191. It dropped to 36500 at 11:45, and wound around that level until 3:30 when it dropped hitting 36372, the low, 3 minutes before the close. It rose 26 points into the close on a volume surge.

The NASDAQ opened at 15759, off 7 points.  It rose to 15855 before 10:30.  I hovered near that level nutil 2:30, hitting 15868, the hi, at noon.  At 3:00 it fell hard, reaching 15729, the lo, 3 minutes before the lo. It the rose 13 points on a volume surge.

The Russell 2000 opened flat at 2249.  It rose to 2272, the hi, up 23, after 10:00.  It stayed above 2265, hitting the hi again at 2:45.  It then dropped hard, hitting 2247, the lo, off 2 points, 3 minutes before the close.  It then rose, ending off a half point. 

This appears to be a counter-current wave still unfolding.


Friday December 31, 2021

SP500 at the close ---  4,766.18   -12.55 (-0.26%)

DJI30 --- 36,338.30   -59.78 (-0.16%)

NASDAQ --- 15,644.97   -96.59 (-0.61%)

Russell 2000 --- 2,245.31   -3.48 (-0.15%)

The SP500 opened at 4775, off 4 points, and quickly rose to 4787, the hi, up 8.  It then fell and stayed slightly negative until 1:00.  It spent most of the afternoon chopping around neutral, but dropped vertically in the last 15 minutes to finish within a half point of the last minute lo, on a volume surge, for a small loss.

Today's action surrounded the critical resistance level identified earlier in the week.  So the year ends on a very uncertain note.  Is a counter-current wave unfolding, or is the index topping and ready to fall?

The DJI30 opened at 36386, off 12, and stayed in negative territory until 1:00, hitting 36304, the lo, off 94, before 12:30.  It then spend most of the afternoon above neutral, hitting 36485, the hi, up 87 after 2:00.  It also took a dive at the end on a volume surge, ending 34 points above the low, for a small loss.

The NASDAQ opened at 15723, off 19.  Ot quickly rose to 15777, the hi, up 36.  It dropped to 15694 around 11:00, and stayed close to that level until the last 15 minutes when it dropped to 15644, the lo, 1 point below the close.  It finished with the day's largest loss.

The Russell 2000 opened at 2246, 0ff 3 points, and climbed to 2258, the hi, up 9, after 10:00.  It meandered close to the neutral line until the last few minutes when it fell to close just a half point above the late-day lo.

These choppy losses over the last few days do not look impulsive; so I still think we are seeing counter-current motion within an upward trend.


Monday, December 20, 2021

Taking Stock - Week of December 20, 2021

Monday, December 20, 2021

SP500 at the close --- 4,568.02 -52.62 (-1.14%)

DJI30 --- 34,932.16   -433.28 (-1.23%)

NASDAQ --- 14,980.94   -188.74 (-1.24%)

Russell 2000 --- 2,139.87   -34.06 (-1.57%)

Not one minute was spent in positive territory by any of these indexes.  And they all lost more than a percent.  This is a thoroughly dismal start to the week.  

Elliott wave analyst Avi Gilbert identified the range 4550 to 4585 as a critical support level to preserve the short term bullish case.  Today's minimum was 4531, and the index stayed below 4550 from about 10:30 until 1:30,  finishing squarely in the support range.  The red line on the chart is at 4550.

So, despite the weak performance, the trend direction is still ambiguous.


Tuesday, December 21, 2021

SP500 at the close ---  4,603.84.  +35.82 (+0.78%)

DJI30 --- 35,492.70   +560.54 (+1.60%)

NASDAQ --- 15,341.09   +360.14 (+2.40%)

Russell 2000 --- 2,202.95   +63.07 (+2.95%)

The SP500 opened at 4595, up 27 points.  It dropped to 4583, the lo, after 10:30.  It rose the rest of the day, closing less than 2 points under the hi. It held support just below the 4550 level mentioned yesterday.  This is the highest close since 12/16.

The DJI30 opened at 35070, the lo, up 137 points.  I hovered near 35509, the hi, most of the time after 1:00.  The close was abut 15 points under the hi.  This is the highest close since 12/16.

The NASDAQ opened at 15140, off 29 points.  It dropped to 15015, the lo, after 10:00.  It rose the rest of the day, closing 8 points under the hi.  It held support at the 144 EMA .This is the highest close since 12/15.

The Russell 2000 opened at 2141, the lo, up 2 points.  It rose the entire day to finish a small fraction of point under the hi for the day's largest gain. It held support at the 144 day EMA. This close the highest since 12/10.


Wednesday, December 22, 2021

SP500 at the close ---  4,696.56   +47.33 (+1.02%)

DJI30 --- 35,753.89   +261.19 (+0.74%)

NASDAQ --- 15,521.89   +180.81 (+1.18%)

Russell 2000 --- 2,221.90   +18.96 (+0.86%)

The SP500 opened at 4650, up a point, and quickly fell to 4645, the lo.  It climbed to 4688 at 1:00, and after a slight draw back rose to 4698, the hi, just before and about a point above the close.

The DJI30 opened at 35492, off 1, and until after 10:00 bounced near 35433, off 60.   It rose to 35762 at 1:00.  After a slight drawback it rose to 35765, just before and 11 points above the close.

The NASDAQ opened at 15319, off 22. It quickly dropped to 15303, off 38, then climbed to 15492 at noon. After a partial drawback it rose to 15526 just before and 4 points above the close.

The Russell opened at 2202, off a fraction. It bounced further into negative territory, hitting near 2195, the lo, off 8.   It climbed to 2219 after 1:00, and after a partial draw back climbed to 2223, a few minutes before and less than a point above the close.

After a rather shaky start this was a day of solid gains.  The SP500 is approaching close to its recent all time highs.  But the other indexes are not.  Today's gains add support to the bullish short term case, but are far from definitive.


Thursday, December 23, 2021

SP500 at the close ---  4,725.79   +29.23 (+0.62%)

DJI30 --- 35,950.56   +196.67 (+0.55%)

NASDAQ --- 15,653.37   +131.48 (+0.85%)

Russell 2000 --- 2,242.75   +20.85 (+0.94%)

The SP500 opened at 4704, up 7 and rose quickly until 11:15 when it level off near 4730.  It climbed to 4740 after 3:45, then fell 15 points into the close.

The DJI30 opened at 35782, up 71 and quickly rose to 35970.  It ran near that level until 1:45, when it rose again hitting 36061, the high after 3:45, then fell 110 points into the close.

The NASDAQ opened at 15545, up 23, and climbed quickly until mid-morning.  It then climbed more slowly until 3:00, when it slipped a bit until 3:30, the rose to 1598, the hi, before dropping 45 points into the close.

The Russell 2000 opened at 2222, up a fraction.  After languishing for an hour it rose, reaching 2248, the hi, at 2:00.  From there, it was a bumpy 6 point slide into the close.

This was a day of substantial gains, only marred by the declines in the closing moments.  This could be the beginning of a down turn or just part of a counter-current wave at some lo level of trend, assuming this week's gains are impulsive. 

That wraps up this week, with the markets closed tomorrow in observance of the Christmas holiday.

Weekly gains -
SP500 + 2.28%
DJI30 + 1.65%
NASDAQ + 3.19%
Russell + 3.11%


Monday, December 13, 2021

Taking Stock - Week of December 13, 2021

Monday, December 13, 2021 

Red Arrow Down 

SP500 at the close --- 4,668.97.  -43.05 (-0.91%)

DJI30 --- 35,650.95   -320.04 (-0.89%)

NASDAQ --- 15,413.28  -217.32 (-1.39%)

Russell 2000 --- 2,180.50  -31.31 (-1.42%)

The SP500 opened at 4710, the day's hi, off 2 points, and fell to near 4670 from 11:30 to noon. It recovered to near 4690 from 3:00 to 3:30, then fell into the close, less than 2 points above the late day lo, on a volume surge.

The DJI30 opened at 35959, the day's hi, off 12 points, and fell near 35620 from 11:00 to noon. It slowly rose to 35790 at 3:45, then fell almost 140 points into the close on a volume surge.

The NASDAQ opened at 15621, off 9 points. It dropped to about 15420 for a while near noon. It rose to 15520 after 3:00, then fell hard after 3:30 to close only 5 points above the late day lo.

The Russell 2000 opened flat at 2212, the day's hi. It dropped to 2169, the lo, at noon, then recovered to 2195 at about 3:15. then fell15 points into the close for the day's largest loss.

This is a dismal start to the week, with each index starting at or near the high, then tumbling to finish close to the day's lo.

At this point, I have no idea if the current trend is up or down. I can justify an up trend continuing based on the SP500 chart; but the Russell 2000 looks like it is heading down.


Tuesday, December 14, 2021 

Red Arrow Down 

SP500 at the close  ---   4,634.09   -34.88 (-0.75%)

DJI30    ---  35,544.18   -106.77 (-0.30%)

NASDAQ   ---   15,237.64   -175.64 (-1.14%)

Russell 2000   ---   2,159.65   -20.84 (-0.96%)

The SP500 opened at 4643, off 26 points.  It fell to near 4607, the lo, off 62, from noon until 2:00.  It reached 4650, an intermediate hi, after 3:30, then fell under 4630 before a slight rise into the close.  At the lo, it was near the 13 and 55 day EMAs, and still above potential support from early September.

The DJI30 opened at 35606, off 45 points.  It bounced around near 35442, the low, from 11:00 to 2:00.  It rose to 35640 after 3:30, then fell under 35500 before a slight rise into the close.  At the lo, it was near both the 13 and 55 day EMAs, and a potential support zone from mid  August.

The NASDAQ opened at 15216, off 197 points.  It reached 15318, the hi, off 96, at 9:45.  I stayed near 15097, the lo, off 316, from 11:00 to 2:00, and rose to 15290 after 3:30.  It then fell to 15210 before a slight rise into the close.  It is hovering in what could be a support level from early September.

The Russell 2000 opened at 2179, off 2 points. It reached 2190, the hi, up 9, before 10:30, and fell to 2153, the lo, off 27, at 2:00. It rose above 2170 at 3:30, then fell to 2156 before  slight rise into the close.  At the low, it was in the vicinity of a support line going back a year.  A strong breach of 2160 would be a very bad sign.  

The idea that the current trend is up is still supportable for the SP500 and DJI30, strained for the NASDAQ, and highly suspicious for the Russell 2000. One way or another, the picture should offer some clarity before the end of the week.  Maybe.  I hope. 


Wednesday, December 15, 2021 

Green Arrow Up

SP500 at the close  ---   4,709.75   +75.66 (+1.63%)

DJI30    ---  35,927.43   +383.25 (+1.08%)
 
NASDAQ   ---   15,565.58   +327.94 (+2.15%)

Russell 2000   ---   2,195.21   +35.56 (+1.65%)

The SP500 opened at 4636, up 2 points, then stayed near 4611, the lo, from 10:00 until 2:00.  There was a sharp but bumpy rise into the hi, just 2 points above the close, with a volume surge in the waning moments. 

The DJI opened at 35549, up 5 points, and quickly fell to 35390, the lo, off 155.  It hovered slightly above that level util almost noon, when it began a slow rise that accelerated after 2:00. This led up to the late day hi, just 16 points above the close, ending on a volume surge.

The NASDAQ opened at 15231, off 7 points.  It slid down to 15055, the lo, off 182, before 12:30.  After 2:00 if started rising up to the close, ending only 10 points under the late day hi.

The Russell 2000 opened at 2160, up a fraction, and dropped to 3131, the lo, off 29 before noon.  After 2:00, it rose, hitting over 2199 about 20 minutes before the close, 5 points lower.

These nice increases are comforting.  But it is still unclear which way the indexes are heading.  One day is not enough to clarify things – so hang on for the next few days.


Thursday, December 16, 2021 

Red Arrow Down 

SP500 at the close  ---   4,668.67   -41.18 (-0.87%)

DJI30    ---  35,897.64   -29.79 (-0.08%)
 
NASDAQ   ---   15,180.43   -385.15 (-2.47%)

Russell 2000   ---   2,152.46   -42.75 (-1.95%)

The SP500 opened at 4719, up 9 points.  It fell pretty steadily to the4652, the lo, off 58, before rising to 4686, then sliding into the close on a volume surge, for a substantial loss, despite the hi and lo both being higher..

The DJI30 opened at 36036, up 109, and rose to 36199, the hi, up 262  It then fell to 35778, the lo, off 149, before 3:00.  It rose to 36025 after 3:30, the slumped to the close on a volume surge for a tiny loss.  Still, the hi and lo were both higher.

The NASDAQ opened at 15629, up 64 points, quickly rose 4 into the hi, then dropped to 15119, the lo, before 3:00.  It rose to 15245 after 3:30, then slid into the close for a huge loss.  Contra that, the hi and lo were both higher.

The Russell opened at 2197, up less than 2 points, and rose to 2216, the hi, up 21, before 10:00.  It fell to 2145, the lo, off 51, then stumbled into the close for a large loss.

This was a strange session with losses ranging from insignificant to massive, but higher extremes in all the indexes.  The Russell is hovering at its support level, with today's range surrounding 2160.  This appears to be a significant level, and a meaningful break lower could be a worrisome signal.


Friday, December 17, 2021 

Red Arrow Down 

SP500 at the close  ---   4,620.64   -48.03 (-1.03%)

DJI30    ---  35,365.44   -532.20 (-1.48%)
 
NASDAQ   ---   15,169.68   -10.75 (-0.07%)

Russell 2000   ---   2,173.93   +21.48 (+1.00%)

The SP500 opened at 4653, off 16 points.  It dropped to 4600, the lo, off 68, at 10:15, then rose to 4667, the hi, off 2, an hour later.  After a smaller drop and rise, it slid from 2:00 into the close, on a volume surge at the end for a substantial loss. The day's range is above the 55 dy EMA, and surrounds the 13 day EMA.

The DJI30 opened at 35800, the hi, off 98 points. It dropped to 35284, the lo, off 611, at 10:15, then rose to 36661 at 11:15.  From there tumbled the rest of the day, closing about 80 points above the lo for a substantial loss,   The day's range surrounds the 13 and 55 day EMAs.

The NASDAQ opened at 15037, of 144 points, and dropped to 14960, the lo, off 220. a few minutes later  It reached 15289, the hi, up 108 at 11:15.  It didn't drop below 15111 again, and snaked around neutral the rest of the day, closing with a tiny loss.  These values are above the 144 EMA , but below the 55 EMA.

The Russell 2000 opened flat at 2153, then dropped to 2125, the lo, off 28.  It hovered near 2186, the hi, up 34, from before 11:00 until after 11:30. It stayed above 2165 he rest of the day, and slid into the close for a substantial gain.  It is straddling the support level around 2160.

It's unusual for the Russell to gains when the other indexes are down.  This might all still be counter-current to the main thrust.  But which way that is heading is ambiguous.  That uncertainty itself suggests counter-current motion.  We'll just have to wait and see.

This week's losses were not enough to negate last week's large gains.

Weekly changes
SP500   –1/94%
DJI30  -1.68%
NASDAQ  -2.95%
Russell 2000  -1.71%