In comments, Art protests about me making Reagan and Bush II the object of scorn over the issue of household debt. He suggests yet another FRED graph, which goes back a little further, and shows more debt burden rise in the 50's. This is Household Credit Market Debt Outstanding divided by Seasonally adjusted Salary Accruals.

I think Art wants to tell a story where debt growth has been on a continuously increasing trajectory through the entire post WW II period. Clearly, this is not the case. The graph above shows there was an actual decrease in debt burden in the 60's, then only a slight increase during stagflation and the moribund Carter administration. Given the context of the previous decade and a half, the Reagan/Bush I regime pretty badly screwed workers. Clinton did not reverse the tide, but - for a while, at least - was able to stop the bleeding. Then Shrub started adding coffin nails by the hundred weight.
Back in the early part of the graph, things don't look so good, either. So we can detect a pattern of Household Debt/Salary Accruals increasing across decades - but ONLY when there is a Rethug in the White House.
Somehow, though, this strikes me as not really being fair to Ike. The increase during his administration is roughly from .5 to .9. This is close to doubling, but the initial value is pretty low. Coming out of WW II household debt was quite low, for a variety of reasons, including war-time rationing and supply constraints. There was probably an excess of savings. There could well have been a pent up demand for credit that expressed itself as a housing boom, to provide necessary shelter and accommodations for the baby boom (frex, me.)
Debt is a problem if it can't be serviced, or if servicing it causes a distortion in standard of living, or spending and saving patterns. I think it's hard to make a case for those things at debt/salary < 1. I'm not prepared to set the break point, but it looks like it could very well be between 1.4 and 2.0 - the Shrub legacy.
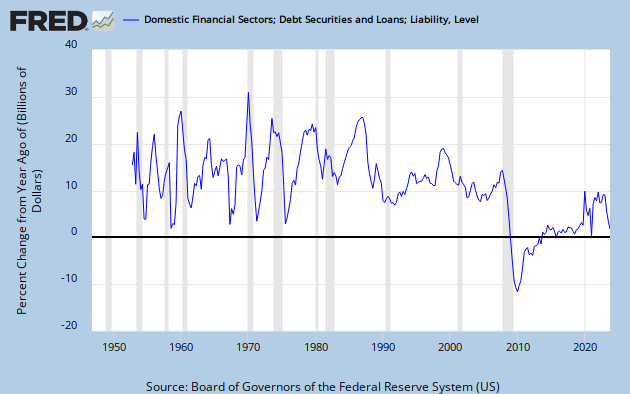
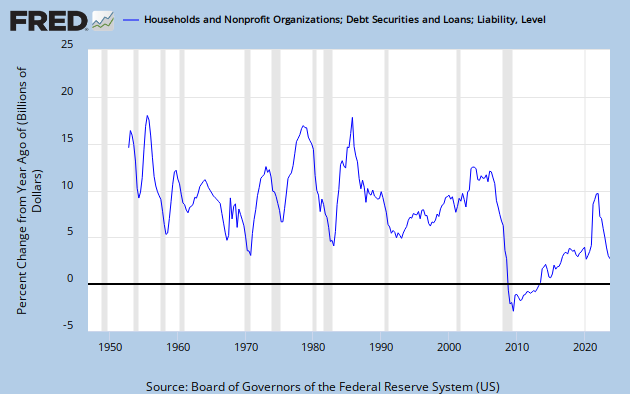
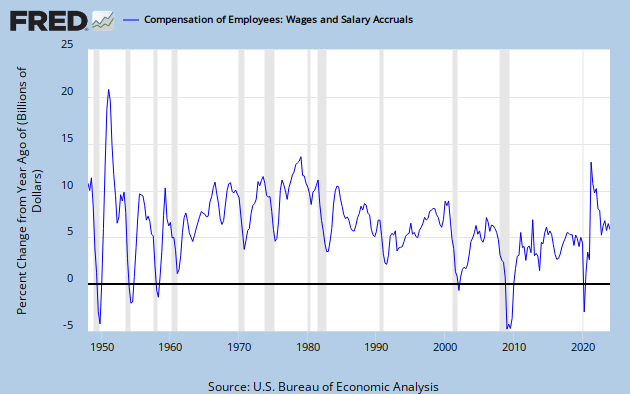
We should also remember that there are a numerator and a denominator. Here are the graphs of year over year increase in household debt and salary accruals. Note the declining trend channel for salaries since the late 70's peak - and the counter-trend move in the 90's. Other than that, I will leave pondering the dynamics of these changes as an exercise for the interested reader. And if you've come this far, you might as well give it some serious thought.
So, to answer this question: "The number was increasing rapidly even in the 1950s. Was that Reagan's fault, too?" I say, no. In those days, Reagan was only responsible for some really bad movies. But I'll add that the question is irrelevant to my assessment of Reagan and Shrub. They destroyed the American Middle Class, and along with it the American Dream. This was no accident, and there's a lot more to the story than just debt. Supply side economics is and always was a sham, designed to enrich the already wealthy at the expense of all the rest of society. Look where we are now. It worked.
.
![[Most Recent Quotes from www.kitco.com]](http://www.kitconet.com/charts/metals/gold/tny_au_xx_usoz_4.gif)


6 comments:
This is good.
"I think Art wants to tell a story where debt growth has been on a continuously increasing trajectory through the entire post WW II period."
Pretty much, yes, I do.
"The graph above shows there was an actual decrease in debt burden in the 60's, then only a slight increase during stagflation and the moribund Carter administration."
True enough. BUT... (and I didn't figure out how to look at this yet)... there was Big Inflation in those years where debt does not rise a lot. I'm thinking, wages went up a lot and maybe additions to total debt went up a lot, but existing debt shrank probably a lot relative to the inflation of the time... and this is probably why the graph flattens out in those years.
"Reagan/Bush I regime pretty badly screwed workers. Clinton did not reverse the tide, but..."
Just to make this explicit, I do not deny such things. But Oh, I am tempted to say No no, not Clinton. Gingrich!!!
But I won't say that. Your clarinet would probably squeak if I did.
"Debt is a problem if it can't be serviced, or if servicing it causes a distortion in standard of living, or spending and saving patterns. I think it's hard to make a case for those things at debt/salary < 1. I'm not prepared to set the break point, but it looks like it could very well be between 1.4 and 2.0 - the Shrub legacy."
(Hesitantly) Yeeeah... But if debt is "on a continuously increasing trajectory" then the Shrub legacy was completely predictable. And at some point -- probably before the troubled '70s -- policy ought to have changed, on the assumption that maybe we had reached the optimum level of debt relative to wages or GDP or whatever. But policy didn't change. And therein lies the problem.
PS: I was the squeaky clarinet player in high school. Thank goodness that's over.
Trombones don't squeak. We blat.
Without getting into conspiracy theories, I don't think any of this is accident or happenstance. Greed is a great motivator for certain personality types. Greed, applied with great success by those with money and power, explains how we got from there to here.
But the trajectory has absolutely not been continuous. Call them subtrends if you prefer, but every change in slope is significant; and reversals even more so. I see no fewer than 9 different slopes in this graph BEFORE the Great Recession, and the Demo vs Rethug differences are strikin. The YoY debt graph has a least 9 peaks between 1950 and 2008; the YoY salary chart has at least 20.
The Shrub legacy would not have been predictable in the 90's, because policy was different then.
When you speak of policy, I think you limit it to monetary policy. OTOH, I am thinking the whole picture - taxation, regulation, labor relations, fiscal programs, foreign trade, enforcement, idiotic wars, both real and virtual . . .
That is how Reagan and Shrub screwed America.
Debt is not THE problem. At most, debt is A problem; at least it is a symptom of the underlying problems: increasing wealth disparity, and asset misallocation from investment into rent-seeking.
Which is why I think your debt per dollar approach largely misses the point - it focuses on a symptom without going after the underlying cause.
Cheers!
JzB
When I speak of policy that does not change, I mean specifically that we always rely on the Fed to fight inflation and never rely on fiscal policy to fight inflation. I mean we have policies that encourage accelerations and decelerations of new uses of credit, but no policy that encourages the repayment of debt. I mean we *say* we need credit for growth, but we *use* credit for everything.
These are the unchanging principles behind every economic policy since World War Two. If these principles do not change, nothing will change. So, the Republicans drive us to disaster at a faster clip than the Democrats. It means nothing. They're both going the same direction. That is the problem.
BTW, unchanging principles can look like a conspiracy. And the fact that they are not a conspiracy will be most difficult to see, for anyone who accepts those principles. Which is everyone.
Art -
Thanks for the clarification.
So, the Republicans drive us to disaster at a faster clip than the Democrats. It means nothing. They're both going the same direction. That is the problem.
You see the forest, but miss the trees. Look at the 60's on the posted graph - an actual reversal. Look at the late 90's - dead flat. Even the damned 70's look pretty damned good compared to damned Reagan or god-damned Shrub - and this is based on only one metric - the one you selected.
I don't think there is any perspective from which your above quote does not fall apart under careful scrutiny.
Cheers!
JzB
supreme hoodie
birkin bag
adidas yeezy
ferragamo belts
yeezy supply
off white
yeezy 500
michael jordan shoes
balenciaga shoes
kevin durant shoes
essayez ceci https://www.dolabuy.su hop à ces gars dolabuy louis vuitton lire toutes les informations ici réplique dolabuy
Post a Comment