Look: I am eager to learn stuff I don't know--which requires actively courting and posting smart disagreement.

But as you will understand, I don't like to post things that mischaracterize and are aimed to mislead.

-- Brad Delong

Copyright Notice

Everything that appears on this blog is the copyrighted property of somebody. Often, but not always, that somebody is me. For things that are not mine, I either have obtained permission, or claim fair use. Feel free to quote me, but attribute, please. My photos and poetry are dear to my heart, and may not be used without permission. Ditto, my other intellectual property, such as charts and graphs. I'm probably willing to share. Let's talk. Violators will be damned for all eternity to the circle of hell populated by Rosanne Barr, Mrs Miller [look her up], and trombonists who are unable play in tune. You cannot possibly imagine the agony. If you have a question, email me: jazzbumpa@gmail.com. I'll answer when I feel like it. Cheers!

Monday, August 30, 2021

Taking Stock - Week of August 30, 2021

Monday, August 30, 2021

Yellow Arrow Sideways

DJI30 Index at the close   ---   35,399.84   -55.96 (-0.16%)

SP500 Index   ---   4,528.79   +19.42 (+0.43%)

The DJI opened at 35472, up 17 points, then fell, hitting a lo of 35374, off 80 at 10:00.  It then climbed, hitting a hi of 35511, up 56, at 11:15.  From there it was a long, slow 112 point slide into the close, with a small loss.

This was a mixed day, with the hi higher by 32 points and the lo higher by 143.  The span was a narrow 136.

The SP500 hovered near its late afternoon hi until after 3:00 when it slid by about 8 points into the close.  It had a clearly up day by 34 and 39 points.  This resulted in a new intra-day by 24 points, and a new closing hi by 19.

The NASDAQ reached its high after 3:00, with a slight slump into the close.  It had a clearly up day by 144 and 199 points; and it reached new all time highs by 144 and 137 points.

The Russell 2000 dropped quickly in the first half hour, then slid more sowly the rest of the day, ending with a half percent loss.  But it had a mixed day, with the hi higher by 5 points, and the lo higher by 51.

All together, this was a confusing session.  The SP500 and the NASDAQ reached new highs.  The DJI and Russell were down at the close, but higher at their highs and lows.  My conclusion is that the broad thrust is still up for all the indexes.

% Changes -
DJI30 -0.16%
SP500 +0.43%
NASDAQ +0.90%
Russell -0.4%

DJI Closings -
8/30/19 - 25403
8/28/20 - 28332
7/30/21 - 34935
8/30/21 - 35400

NYSE Internals -
A/D = 1411/1871 = 0.75
A/D Vol = 0.66
New Hi/Lo = 194/31 = 6.28


Tuesday. August 31, 2021

Yellow Arrow Sideways

DJI30 Index at the close   ---   35,360.73   -39.11 (-0.11%)

SP500 Index   ---   4,522.68   -6.11 (-0.13%)

The DJI opened at 35391, off 8 points, reached a hi of 35450, up 50, then slid the rest of the day to end up 31 points under the opening.  This is a clearly down day by 61 and 85 points.  After the 8/16 hi and the 8/24 local lo, the Index might now be in a counter-current corrective wave at some low level of trend.  The short term challenge is to stay above the up-slanting trend line.

The SP500 mirrored the DJI, and ended with a near identical result.  It had an inside day with the the hi lower by 6 points, and the lo higher by 2.  These values are clustered closely around the upper trend line, slightly below yesterday's all time highs.

The NASDAQ spent most of the day in the red, with a couple briefs pops above neutral, and ended slightly negative.  It had an inside day, lower by 9 points at the hi, and higher by 37 at the day's lo.  After a string of new all time highs, today's finish is slightly under the peak.

The Russell 2000 made a brief excursion into negative territory, then spent the rest of the day in the green, and closed near the day's hi.  It had a mixed session with the hi and lo lower by 9 and 4 points, respectively, contra the 8 point gain at the close.

This still looks like a pause in the top level upward trend.  As always, follow-through is important, so tomorrow deserves a close watch.

NYSE volume was more than 50% above average today.  I never noticed this before, but it seems to be a regular occurrence on the last trading day of the month.

Some economic reports come out this week: the ADP job report and the ISM manufacturing report tomorrow, then the BLS job report and the services ISM report on Friday.  Presumably, the FED can be influenced by these data.

% Changes -
DJI30 -0.11%
SP500 -0.13%
NASDAQ -0.04%
Russell +0.34%

DJI Closings -
8/30/19 - 25403
8/31/20 - 28430
7/30/21 - 34935
8/31/21 - 35338

NYSE Internals -
A/D = 1837/1466 = 1.25
A/D Vol = 1.50
New Hi/Lo = 147/33 = 4.45


Wednesday, September 1, 2021

Yellow Arrow Sideways

DJI30 Index at the close   ---   35,312.53   -48.20 (-0.14%)

SP500 Index   ---   4,524.09   +1.41 (+0.03%)

The DJI opened at 35388, up 27 points.  It dropped to the lo of 35287, off 74, before 11:30, climbed to the hi of 35407, up 37, before 1:00.  It slid a little lower for an hour and a half, then fell harder into the close for an 48 point loss.  As somewhat of a small bright spot, there was a 25 point rise in the closing moments on a modest volume surge.

This is a clearly down day by 42 and 3 points.  

The span was a moderate 120.  The index has been drifting down from the 8/30 hi, but is still above 8/27 lo.  The range of 35250 to 35300 has been touched a few times in the last 5 trading days, from both sides.  This might be a support level to look for, short term

The SP500 was in the green all day, peaking in early afternoon, then mimicking the DJI into the close, including a higher volume blip up at the end, resulting in a minuscule gain of less than a point and a half. It had a clearly up day by about 6 points at either end, and missed new highs by a quarter point intra-day and 5 points at the close.

The NASDAQ also reached it peak in early afternoon, then fell into the close.  But it had a clearly up day, and not by a little – 100 points at either end.  It also achieved new highs, by 91 points intra-day and 43 at the close.

The Russell 2000 opened slightly positive, dipped briefly into the red, reached a hi in early afternoon, then ran mostly flat with a slight slump, finishing with a gain of over a half point.  It had a clearly up day by 16 and 4 points, and was today's big winner.

Every index followed its own path to its own conclusion, with non-conformances everywhere..

DJI30 -0.14%
SP500 +0.03%
NASDAQ +0.33%
Russell +0.58%

DJI Closings -
8/30/19 - 25403
9/01/20 - 28646
7/30/21 - 34935
9/01/21 - 35312

NYSE Internals -
A/D = 2054/1260 = 1.63
A/D Vol = 1.22
New Hi/Lo = 186/19 = 9.79


Thursday, September 2, 2021

Green Arrow Up

DJI30 Index at the close   ---   35,443.82   +131.29 (+0.37%)

SP500 Index   ---   4,536.95   +12.86 (+0.28%)

The DJI opened at 35353, up 41 points, and immediately rose to 35468, up 155.  After a decline, it rose to the hi of 35475, up 163, before 11:00.  It slipped back to 35350 after 2:30, bounced above 35400 at 3:00, slipped back to 35350 a couple times after 3:30, then rose 95 points in the closing moments, resulting in a small gain.

After 3 downish, but basically sideways days, this is a clearly up day by 68 and 61 points.  The span was 126 points.  This was the 4th consecutive session of 160 or less.

The SP500 had a similar contour and a clearly up day by 9 and 3 points.  These small margins were enough to achieve new highs by about 8 points, both intra-day and at the close.

The NASDAQ also had a roughly similar contour, but dipped briefly into the red at the afternoon lo.  It finished with the day's smallest gain.  This was an outside day with the hi higher by less than a point, and the lo lower by 22.  But this was enough to provide new highs, by 0.57 point intra-day and 22 points at the close.

The Russell 2000 also had a somewhat similar contour, but with a smaller afternoon dip, and less of a rise at the end.  It had a clearly up day by 17 and 23 points. It is now only 50 points under its all time intra-day hi, and 56 at the close, both from 3/15.

NYSE internals were quite strong today.

% Changes -
DJI30 +0.37%
SP500 +0.28%
NASDAQ +0.14%
Russell +0.74%

DJI Closings -
8/30/19 - 26403
9/02/20 - 29101
8/02/21 - 34838
9/02/21 - 35444

NYSE Internals -
A/D = 2131/1125 = 1.89
A/D Vol = 2.07
New Hi/Lo = 251/18 = 13.94
Friday, September 3, 2021

Yellow Arrow Sideways 

DJI30 Index at the close   ---   35,369.09   -74.73 (-0.21%)

SP500 Index   ---   4,535.43   -1.52 (-0.03%)

The DJI opened at 35402, off 42 points, and fell to a low of 35269, off 174 at 10:00.  It reached a hi of 35423, off 21 after 11:00, then slid to 35340 at noon and ran sideways for an hour. It reached the hi again after 2:00 and ran sideways until after 3:00, followed by a 55 point drop into the close, on a volume surge.

This is a clearly down day by 53 and 79 points.  The spread was 153 points. This entire week has been in a tepid trading range of only 224 points.  It looks as if a complex corrective wave is still playing out, and will be as long as the index stays below the 8/16 hi of 35631.   And we don't need to be concerned about a larger correction [or worse] as long as it stays above the 8/19 lo of 34690.

The SP500 Started in the red, went slightly positive in the afternoon, then slid at the end for a tiny loss.  It had a clearly down day by the small margins of 4 and 3 points.

The NASDAQ started slightly negative, but quickly went positive and stayed there, ending with a small gain. It was a mixed day, with the hi and lo lower by about 4 points at either end, but a finish near the top of the range for a 32 point gain and a new all time hi by the same amount.

The Russell 2000 had a clearly down day by 6 points at the top and 1 at the bottom.  But it closed near the bottom of the range for a half percent loss.

This was a confusing day to top off a confusing week.  Markets are closed Monday for Labor Day.

Weekly % Changes
DJI30 -0.24%
SP500 +0.58%
NASDAQ +1.55%
Russell +0.62%

Daily % Changes -
DJI30 -0.21%
SP500 -0.03%
NASDAQ +0.21%
Russell -0.52%

DJI Closings -
9/03/19 - 26118
9/03/20 - 28293
8/03/21 - 35116
9/03/21 - 35369

NYSE Internals -
A/D = 2131/1125 = 1.89
A/D Vol = 2.07
New Hi/Lo = 251/18 = 13.94


Monday, August 23, 2021

Taking Stock -- Week of August 23, 2021

Monday, August 23, 2021

Green Arrow Up

DJI30 Index at the close --- 35,335.71 +215.63 (+0.61%)

SP500 Index --- 4,479.53 +37.86 (+0.85%)

The DJI opened at 35160, the day's lo, up 41 points, and quickly jumped up to 35360, up 241, on the way to 35410, up 290, after 11:00. It then ran mostly sideways, reaching the high of 35429, up 309, after 1:00. It then stayed above 35370 until the closing moments, when there was a 34 point droop into the close on a volume surge. It bounced off of its 55 day EMA on Thursday to close today 290 points under the 8/16 all time hi.

This is a clearly up day by 252 points at the top and 294 at the bottom. The span was 268. This is a nice gain, but the loss of 93 points from the top to the close is disturbing.

The SP500 also had a clearly up day, by 46 and 43 points. It achieved a new all time intra-day hi of 4490, about 10 points above that of 8/16. It missed a new closing hi by less than a quarter point. It had an unsettling 10 point drop from the hi to the close, also on a volume surge.

The NASDAQ also had a clearly up day by 241 and 205 points. After bouncing off its 55 day EMA on Thursday, it set new all time highs by 65 points intra-day and 48 at the close today.

The Russell 2000 was the day's big winner. It was clearly up by 41 and 42 points, and climbed above its support zone. It's about 150 points below its all-time highs reached on 3/15, and under its 55 day EMA.

Yahoo Finance doesn't show NASDAQ nor Russell volume on their daily charts, so I don't know how it played out on those indexes.

The question on Friday was whether the gains were counter-trend or leading up again. That's still the question today. Tomorrow's follow-through [or lack thereof] will be important.

% Changes -
DJI30 +0.61%
SP500 +0.85%
NASDAQ +1.55%
Russell +1.88%

DJI Closings -
8/19/19 - 26252
8/21/20 - 28492
7/23/21 - 35062
8/23/21 - 35336

NYSE Internals -
A/D = 2281/1062 = 2.15
A/D Vol = 3.41
New Hi/Lo = 117/75 = 1.56


Tuesday, August 24, 2021

Green Arrow Up

DJI30 Index at the close   ---   35,366.26   +30.55 (+0.09%)

SP500 Index   ---   4,486.23   +6.70 (+0.15%)

The DJI opened at 35383, up 47 points. Before 10:00 it reached 35428, up 92.  It fell back to 35363 after 10:00, climbed to 35420, then fell to 35363 again at noon.  It reached the hi of 35445, up 110, after 12:00.  It slid for an hour, then took a hard 60 point turn down after 3:15, hitting bottom 5 minutes before and 3 points under the marginally higher close. The index did not achieve new highs.

This is a clearly up day, by only 17 points on the top, but, perhaps more importantly, 202 at the bottom.  The span was only 82 points, the smallest this year.

The SP500 also had a clearly up day, by 3 and 32 points.  Its late session fall off was less sever, and it achieved new all time highs by 3 points intra-day and 7 at the close.  On today's graph I've redrawn the lower trend line to accommodate recent lows, and added a short term top trend line to reflect recent highs.

The NASDAQ reached its hi just before 3:30, and had a much smaller slide into the close, staying well above its mid-day lo.  For the 2nd day in a row, it achieved new intra-day and closing highs, by 71 and 74 points. The span was 70. It was clearly up by 71 and 189 points.

The Russell 2000 trended up all day, and was the big winner, gaining just over 1%.  It is still more than 100 points under its 3/15 highs.  It was clearly up by 21 and 40 points.

All the indexes were up, and there were some new highs, suggesting that the gains are not counter current.  The Russell left the other indexes in the dust.  

% Changes -
DJI30 +0.09%
SP500 +0.15%
NASDAQ +.52%
Russell +1.02%

DJI Closings -
8/23/19 - 25629
8/24/20 - 28308
7/23/21 - 35062
8/24/21 - 35366

NYSE Internals -
A/D = 2240/1084 = 2.07
A/D Vol = 3.67
New Hi/Lo = 114/50 = 2.28


Wednesday, August 25, 2021

Green Arrow Up

DJI30 Index at the close   ---   35,405.50   +39.24 (+0.11%)

SP500 Index   ---   4,496.19   +9.96 (+0.22%)

The DJI opened at 35389, up 23 points, and quickly fell to 35288, off 79.  But it turned back up, and by 10:45 reached 35450, up 84.  It ran sideways for an hour, then climbed to 355501, up 135, before 1:00.  From there, it was a long, slow, 95 point slump into the close.

This is an outside day, with the hi higher by 56 points, and the low lower by 75.  The spread was 214.

The SP500 had a clearly up day by 8 and 3 points, and new highs, by 9 points intra-day and 10 at the close.   It had a smaller afternoon slide

The NASDAQ had a choppy climb from its mid-morning lo. It was a clearly up day by 25 and 46 points.  It achieved new all time highs by 25 pints intra-day and 22 at the close.


The Russell 2000 reached its hi before 2:00, and slid from there into the close, but still maintained the day's largest percentage gain.  It had a clearly up day by 20 and 18 points, and is now about in the mid-range of its 5-month-old trading range.  This makes 3 consecutive days of small caps leading the market.

% Changes -
DJI30 +0.09%
SP500 +0.11%
NASDAQ +.15%
Russell +0.37%

DJI Closings -
8/23/19 - 25629
8/24/20 - 28308
7/23/21 - 35062
8/24/21 - 35366

NYSE Internals -
A/D = 1897/1345 = 1.41
A/D Vol = 1.77
New Hi/Lo = 141/36 = 3.92


Thursday, August 26, 2021

Red Arrow Down

DJI30 Index at the close   ---   35,213.12   -192.38 (-0.54%)

SP500 Index   ---   4,470.00   -26.19 (-0.58%)

The DJI opened at 35450, up 44 points and quickly rose tp 35498, up 93. It then dropped to 35275, off 131, at 11:00.  It rose above 35340 before 11:30 and hung near that level for a couple hours.  It slid down to the low of 35205 after 3:00, bounced slightly, than closed near the low, right at the 13 day EMA line.

This is a clearly down day by 3 and 83 points. The span was 293.  It looks to be counter-current to the upward trend, rather than a turn back down.

The SP500 had a similar contour, and a clearly down day following 3 days of new highs. This also appears to be counter-current. 

The NASDAQ also had a similar contour, and an outside day, by 0.20 points at the top, and 22 at the bottom.  It also appears to be continuing its rise.

The Russell 2000 also had a similar contour, and a clearly down day by 8 and 14 points.  It is hovering just below the mid-point of its 5 month long trading range.

Tomorrow's action will be important in suggesting which way we are heading.  Volumes were exceptionally light today. 

% Changes -
DJI30 -0.54%
SP500 -0.58%
NASDAQ -.64%
Russell -1.13%

DJI Closings -
8/26/19 - 25899
8/26/20 - 28332
7/26/21 - 35144
8/26/21 - 35213

NYSE Internals -
A/D = 1897/1345 = 1.41
A/D Vol = 1.77
New Hi/Lo = 141/36 = 3.92


Friday, August 27, 2021

Green Arrow Up

DJI30 Index at the close   ---   35,455.80   +242.68 (+0.69%)

SP500 Index   ---   4,509.40   +39.40 (+0.88%)

The DJI opened at 35231, up 18 points.  It quickly jumped to 35322, up 109.  At 10:00 it jumped again, reaching 35463, up 250, before 10:30.  From there, it ran mostly sideways, reaching the day's hi of 35479 before 3:30.

This was an inside day, with the hi lower by 19 points, and the lo higher by 26.  The spread was 248. The close was only 23 points under the hi.

The SP500 had a clearly up day by 17 and 5 points.  It also achieved new all time highs by 12 points intra-day and 13 at the close.

The NASDAQ had a clearly up day by 86 and 29 points.  It achieved new highs by 85 points intra-day, and by 88 at the close.

The Russell 2000 had a clearly up day by 37and 2 points, and was the day's big winner with a 2.85% gain. At the close, it is 82 points under the 3/15 hi of 2360.

So it looks like the main trend is still up.

% Changes -
DJI30 +0.69%
SP500 +0.88%
NASDAQ +1.23%
Russell +2.75%


NYSE Internals -
A/D = 2731/568 = 4.81
A/D Vol = 6.62
New Hi/Lo = 165/32 = 5.16


Monday, August 16, 2021

Taking Stock - Week of August 16, 2021

Monday, August 16, 2021

Green Arrow Up

DJI30 Index at the close --- 35,625.40 +110.02 (+0.31%)

SP500 Index --- 4,479.71 +11.71 (+0.26%)

The DJI opened at 35461, off 25 points, and 20 minutes later hit the lo of 35232, off 283. It climbed pretty steadily from there, reaching positive territory a little after 2:00 and ending with a 110 point gain.

This is an outside day by the highly unbalanced margins of 21 points at the top and 243 at the bottom. The span was 399. This morning I didn't expect new highs to occur today. But they did, by 21 points intra-day and 110 at the close.

The SP500 had a similar contour, an outside day, and new intra-day and closing highs, by about 12 points either way.

The NASDAQ also had a similar contour, but couldn't reach positive territory. It had a clearly down day by 56 and 187 points.

The Russell 2000 Also had a minimum in the morning and rose to an intermediate hi near noon, then ran mostly sideways with a slight downward bias. It had a clearly down day by about 20 points at both ends, and the close.

This is a confusing day, and a strange start to the week.

% Changes -
DJI30 +0.31%
SP500 +0.26%
NASDAQ -0.20%
Russell -0.69%

DJI Closings -
8/16/19 - 25886
8/14/20 - 27931
7/16/21 - 34688
8/16/21 - 35625

NYSE Internals -
A/D = 1171/2131 = 0.55
A/D Vol = 0.39
New Hi/Lo = 147/80 = 1.84


Tuesday, August 17, 2021

Red Arrow Down

DJI30 Index at the close   ---   35,343.28   -282.12 (-0.79%)

SP500 Index   ---   4,448.08   -31.63 (-0.71%)

The DJI opened at 35500, off 125 points, and by 10:00 fell to 35260, off 365.  After a brief bounce it resumed falling, hitting a lo of 35120, off 505, before 2:00.  This might be a support level.  It bounced off that level again about an hour later then started a choppy climb into the close.  The gain in the last few minutes was on a slight volume surge.

The SP500 had a similar contour and result, also with a volume spike on a small rise at the end.  There could be support near today's lo at 4418

The NASDAQ's performance was roughly similar, but with a larger percentage loss.  It is now 1.6% under its 8/05 hi.

The Russell 2000 started off a couple points, lurched down to a minimum at 1:00, then chopped up to its close, for the day's largest loss.  At its lo, it touched into its likely support range.  At its close it is off the 3/15 hi by 7.75%

Each Index had a clearly down day, and each touched a potential support zone.

Elliot waver Avi Gilbert has been calling for a 200 to 300 point pull back in the SP500, followed by a rise to at least 4600 later in the year.  From yesterday's hi, that drop would land between 4180 and 4280 – almost identical to the support range outlined in red on today's chart. The middle of this range would be a correction of 5.6%.

A comparable loss would be about 1600 to 2500 points in the DJI.  The bottom of that range is slightly below the support line on yesterday's DJI chart.  

As noted, the Russell has been struggling for months, and is already off by almost 8%

NYSE internals were very weak, with new lows outnumbering new highs for the first time since 7/19.

% Changes -
DJI30 -0.79%
SP500 -0.71%
NASDAQ -0.93%
Russell -1.19%

DJI Closings -
8/16/19 - 25886
8/17/20 - 27845
7/16/21 - 34688
8/17/21 - 35158

NYSE Internals -
A/D = 899/2343 = 0.38
A/D Vol = 0.34
New Hi/Lo = 87/100 = 0.87


Wednesday, August 18, 2021

Red Arrow Down

DJI30 Index at the close   ---   34,960.69   -382.59 (-1.08%)

SP500 Index   ---   4,400.27   -47.81 (-1.07%)

The DJI opened at 35310, off 33 points, and quickly dropped to 35190, off 153.  Shortly after 10:00 it rebounded to 35352, up 9.  It slipped back to 35250 after 12:30, rose to 35335 after 2:00, then fell hard into the close.  What I could see in front of the pay wall at Barrons said this:

“Minutes from the Federal Reserve’s latest meeting suggest tapering of monthly asset purchases may start this year as most participants said the Fed has hit its objective on the inflation prong of its dual mandate.

The news sent stocks lower in afternoon trading, with the S&P 500 and Nasdaq 100 paring early gains to fall 0.3% and0.1%, respectively.”

They fell further after this late afternoon report.  All the indexes fell in unison, so this is likely a cause and effect situation.  But, it also likely that the news was merely a catalyst that gave the markets the excuse they were looking for to do what was about to happen anyway.  Yesterday I mentioned the expected correction.  This could well be the start of it.

This is a clearly down day by 131 points at the top and 112 at the bottom.  The spread was 413 points, the largest since 640 on 7/20.

The SP500 mirrored the DJI.  It was clearly down by 8 points at the top, and 34 at the bottom.  

The NASDAQ ran flat and close to neutral for most of the day, then followed the other indexes down after 2:00.   It was clearly down by 20 and 35 points. 

The Russell 2000 started negative, but quickly went green and stayed there until the post 2:00 collapse.  It had an inside day with the hi lower by 9 points and lo higher by 5.  It is hovering just above its support zone.

The losses were a bit above or below 1%.  This is not an unusual occurrence.  But after the earlier action this week it is concerning.

% Changes -
DJI30 -1.08%
SP500 -1.07%
NASDAQ -0.89%
Russell -0.84%

DJI Closings -
8/16/19 - 25886
8/17/20 - 27845
7/16/21 - 34688
8/17/21 - 35158

NYSE Internals -
A/D = 899/2343 = 0.38
A/D Vol = 0.34
New Hi/Lo = 87/100 = 0.87


Thursday, August 19, 2021

Red Arrow Down

DJI30 index at the close   ---   34,894.12   -66.57 (-0.19%)

SP500 Index   ---   4,405.80   +5.53 (+0.13%)

The DJI opened at 34875, off 86 points.  Per the chart at Yahoo finance, it fell to a lo of 34690, off 270.  It made a couple  zig-zags into the close, including a slight rise in the waning moments on a volume surge.  This is a clearly down day by the margins of 359 points at the top and 253 at the bottom.  The span was 308.  The low reached below the 55 day EMA for the first time since 7/19.  The daily chart posted at Yahoo finance is not consistent with the lo posted in the day's data.  So I'm not sure which of today's 3 dips was to the lo.   If it was the first of the three, then that value, 34690, might now be a higher support level.  If that is the case, there should be a recovery tomorrow.

The SP500 had a roughly similar contour, but at a higher level, and it finished with a slight positive.  At its low, it stayed above the 55 day EMA.  A test of that line might be meaningful

The NASDAQ followed the SP500, and also wound up with a slight positive.  At its lo, it slightly pierced its trend line from the 3/23/20 lo.

The Russell 2000 started negative and bounced lower all day, losing more than a percent.  It landed in the support band that has been in play since the beginning of the year.

NYSE internals were very weak.

% Changes -
DJI30 -.19%
SP500 +0.13%
NASDAQ +0.11%
Russell -1.22%

DJI Closings -
8/19/19 - 26136
8/19/20 - 27740
7/19/21 - 33962
8/19/21 - 34894

NYSE Internals -
A/D = 968/2350 = 0.41
A/D Vol = 0.26
New Hi/Lo = 47/118 = 0.40


Friday, August 20, 2021

Green Arrow Up

DJI30 Index at the close   ---   35,120.08   +225.96 (+0.65%)

SP500 Index   ---   4,441.67   +35.87 (+0.81%)

The DJI opened at 34918, up 24 points.  After a quick drop to 34867 it started climbing and reached 35100, up 206, after 10:30.  It pulled back about 40 points a few minutes later, then turned higher again, reaching the hi of 35177 before 1:00.  It pulled back to 35050 before 3:00, then rose 70 points into the close.

This is a clearly up day by 199 and 177 points.  The spread was 310.

The SP500 opened up 5 points and followed a similar contour to the DJI.  It had a clearly up day by 26 points at the top and 37 at the bottom.

The NASDAQ was also clearly up, by 111 and 148 points.

The Russell 2000 is frequently the most volatile index, based on daily percent changes.  It was also clearly up by 111 and 148 points.  At the close it inched up above the top of its presumed support zone.

This is a positive end to an otherwise dismal week.  Is it the resumption of an uptrend, or just a counter-current move in a new downward trend, post all time highs?  Stay tuned for next week's exciting episodes of Where Do We Go From Here?

% Changes -
DJI30 +0.65%
SP500 +0.81%
NASDAQ +1.10%
Russell +1.65%

DJI Closings -
8/19/19 - 26136
8/19/20 - 27740
7/19/21 - 33962
8/19/21 - 34894

NYSE Internals -
A/D = 968/2350 = 0.41
A/D Vol = 0.26
New Hi/Lo = 47/118 = 0.40


Monday, August 9, 2021

Taking Stock -- Week of August 9, 2021

Monday, August 9, 2021

Orange Arrow Down a little

DJI30 Index at the close --- 35,101.85 -106.66 (-0.30%)

SP500 Index --- 4,432.35 -4.17 (-0.09%)

The DJI opened at 35230, up 21 points, and the days hi. It dropped, hitting the day's lo, 35041, at 10:30, and neve saw green again. It rose near 35150, off 59 points, at noon, and stayed near that level until after 3:00, when it took a roller coaster ride into the close. This is a clearly down day by the small margins of 17 and 36 points. And by those margins is off from Friday's all time highs. The span was a rather modest 188.

The SP500 also started in the red, had a roughly similar contour, and touched green for an instant at 2:30 before settling into a minuscule loss. It also had a clearly down day, by 1.4 and 4.3 points. And by those margins is off from Friday's all time highs.

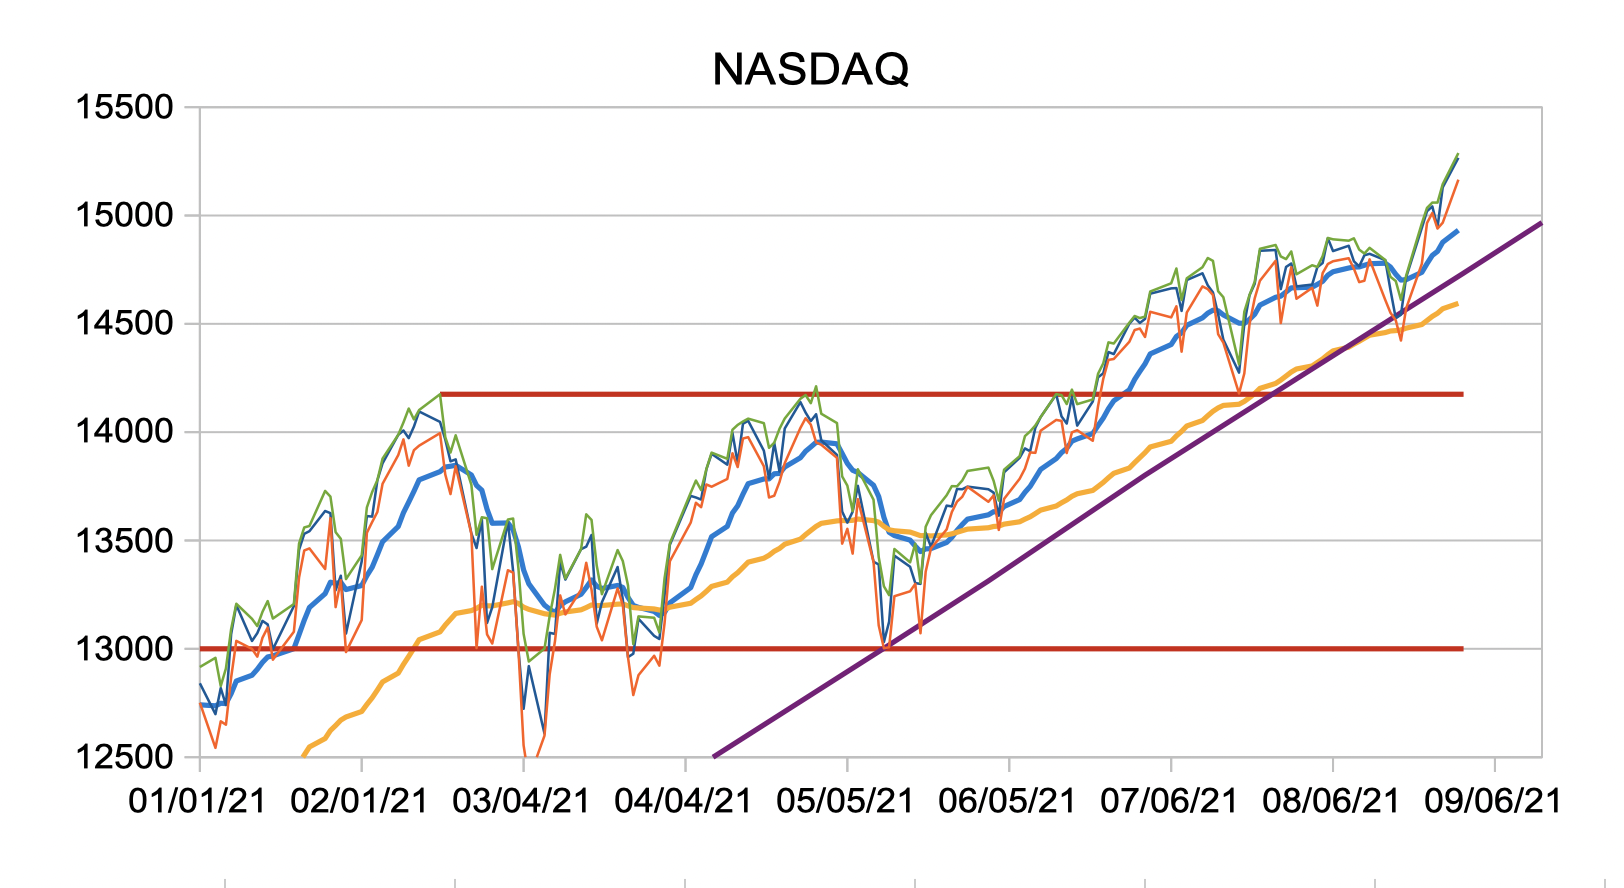
The NASDAQ started slightly negative, quickly moved into positive territory and stayed there the rest of the session. It had an inside day, with the hi lower by 6 points, and the lo higher by 14. It's only slightly below the all-time highs achieved on Thursday

The Russell 2000 started negative and stayed there all day. It had a clearly down day by small margins, and had the day's largest percentage loss. It's about in the middle of its trading range since February.

This was a rather ho-hum day of small moves on below average volumes. I don't think we learned much

% Changes -
DJI30 -0.30%
SP500 -0.09%
NASDAQ +1.16%
Russell -0.58%

DJI Closings -
8/05/19 - 26287
8/07/20 - 27433
7/09/21 - 34870
8/09/21 - 35102

NYSE Internals -
A/D = 1251/2038 = 0.61
A/D Vol = 0.72
New Hi/Lo = 110/29 = 3.79


Tuesday, August 10, 2021

Green Arrow up

DJI30 Index at the close   ---   35,264.67   +162.82 (+0.46%)

SP500 Index   ---   4,436.75   +4.40 (+0.10%)

The DJI opened at 35135, up 33 points. After a quick dip to 35092, off 10, it rose, hitting 35265 before 10:30.  The rest of the day, it wound around 25250, with a 25 point rise into the close.  This is a clearly up day by 55 and 51 points.  The span was 193.  This was enough to give the Index new intra-day and closing highs by 38 and 56 points

The SP500 had a similar morning, with a mid-morning slip into negative territory and a recovery to the opening value around noon.  But it slid all afternoon, ending with a tiny up-tic on a volume surge that moved it from neutral to a small gain.  It had a clearly up day by about 5 points at either end.  This was enough to squeak out new highs by 4 ½ points intra-day and a half point at the close.

The NASDAQ opened slightly positive, dropped negative and stayed there, hitting the lo after 11:00. It made a partial recovery until noon, then slid the rest of the day.  It had an inside day by small margins.

The Russell 2000 dipped briefly into the red before 10:00, rose to a hi before noon, then moved mostly sideways with a slight downward bias the rest of the day.  It had a mixed session, with the hi and lo each down by about 2 points, and a 5 point gain at the close.

Even with some new highs this was a rather uneventful day.  The most notable thing was that each index followed its own path.  So nonconformance continues.

% Changes -
DJI30 +0.46%
SP500 +0.10%
NASDAQ -0.49%
Russell +0.20%

DJI Closings -
8/05/19 - 26287
8/07/20 - 27433
7/09/21 - 34870
8/09/21 - 35102

NYSE Internals -
A/D = 1788/1525 = 1.17
A/D Vol = 1.81
New Hi/Lo = 160/48 = 3.33


Wednesday, August 11, 2021

Green Arrow Up

DJI30 Index at the close   ---   35,484.97   +220.30 (+0.62%)

SP500 Index   ---   4,447.70   +10.95 (+0.25%)

The DJI opened at 35301, up 36 points, and 20 minutes later reached 35491, up 227, and a new intra-day hi.  At 11:45 it slid to 35410, up 145. It went sideways between those values through the end of the session, for a 222 point gain.   This gives us new all time highs, by 216 intra-day and 220 at the close.

This was a clearly up day, by 216 and 209 points.  The spread was only 200.  

The SP500 was close to flat all day, but was still clearly up, eking out new all time highs by about 4 points intra-day and 9 points at the close.

The NASDAQ opened positive then quickly fell negative, and stayed there for the rest of the day.  It rose all afternoon from a mid-day minimum, finishing with a small loss.  It had a clearly down day.

The Russell 2000 started up less than a point, had a minimum near mid-day, then rose and finished positive by 11 points.

Again, the contours were dis-similar.  

% Changes -
DJI30 +0.62%
SP500 +0.25%
NASDAQ -0.16%
Russell +0.49%

DJI Closings -
8/09/19 - 26287
8/11/20 - 27687
7/09/21 - 34870
8/11/21 - 35488

NYSE Internals -
A/D = 2205/1084 = 2.03
A/D Vol = 2.37
New Hi/Lo = 160/34 = 5.29


Thursday, August 12, 2021

Orange Arrow Sideways

DJI30 Index at the close   ---   35,499.85   +14.88 (+0.04%)

SP500 Index   ---   4,460.83   +13.13 (+0.30%)

The DJI opened at 35482, off 3 points, and 15 minutes later hit the hi of 35511, up 26.  It then fell, hitting the lo of 35353, off 132. shortly after 10:00 and again shortly after 11:00.  It then rose, and from 12:15 until 2:45 it went sideways between 35420 and 35460.  It then rose on volume surges at 3:30 and the close, ending with a tiny gain.

This is a clearly up day, with the hi and lo higher by 10 and 52 points.   The spread was 158 points, the smallest since 142 on 7/13.

The SP500 started negative, moved positive before noon and kept climbing, ending with a .3% gain.  This was an outside day by 12 points at the top and a half point at the bottom.  These small gains were enough to cause new all time highs by about twelve points both intra-day and at the close.

The NASDAQ had a contour similar to the SP500, starting negative and after a dip moving mostly positive the rest of the session.   It had an inside day, and therefore no new highs.

The Russell 2000 started negative, slumped, the snaked upward the rest of the day, but never reached positive territory.  It has been trading in a narrow range for since 7/20.

It's every index for itself.

% Changes -
DJI30 +0.04%
SP500 +0.30%
NASDAQ +0.35%
Russell -0.28%

DJI Closings -
8/09/19 - 26287
8/11/20 - 27687
7/09/21 - 34870
8/11/21 - 35488

NYSE Internals -
A/D = 1511/1764 = 0.86
A/D Vol = 0.66
New Hi/Lo = 162/43 = 3.77


Friday, August 13, 2021

Yellow Arrow Sideways

DJI30 Index at the close   ---   35,515.38   +15.53 (+0.04%)

SP500 Index   ---   4,468.00   +7.17 (+0.16%)

The DJI opened at 31552, up 52 points.  It reached a hi of 35611, up 111, less than 20 minutes later.   Shortly after 10:00 it fell to a lo of 35486, off 14.  It climbed back up to 35550 at 11:15, and ran mostly sideways until 2:00 when it turned down and oscillated to a lo of 35475 at 3:55.  It then rose 41 points into the close on a volume surge.  Since mid June the Index has held below the bottom of what was its up-slanting trend channel.

This is a clearly up day by 100 points at the top and 122 at the bottom.  But the span is only 136 points, the smallest of the year.  This results in new all time highs, by 109 points intra-day, and 30 points at the close.  In this context, the puny 14 point gain is confusing.

The SP500 was basically flat all day, trading in a range of only 7.55 points.  But this was enough to result in new all time highs by 6.6 points intra-day and 7.17 at the close.

The NASDAQ had a clearly up day by 26 points at the top and 98 at the bottom. It crossed neutral several times and finished with a 6.64 point gain.

The Russell 2000 was negative all day and slid at the finish, losing almost a percent. 

% Changes -
DJI30 +0.04%
SP500 +0.16%
NASDAQ +0.04%
Russell -0.93%

DJI Closings -
8/09/19 - 26287
8/11/20 - 27687
7/09/21 - 34870
8/11/21 - 35488

NYSE Internals -
A/D = 1568/1721 = 0.91
A/D Vol = 0.73
New Hi/Lo = 169/44 = 3.84


Monday, August 2, 2021

Taking Stock. Week of August 2, 2021

Monday, August 2, 2021

Yellow Arrow Sideways

DJI30 Index at the close   ---   34,838.16   -97.31 (-0.28%)

SP500   ---   4,387.16   -8.10 (-0.18%)

The DJI30 Index opened at 34969, up 33 points, and 20 minutes later reached a new intra-day hi at 35192. up 257.  From there it was a rather steady slide to the lo of 34808, off 127, and just 30 points below the close.

This is an outside day, with the hi higher by 86 points, and the lo lower by 63.  The span was 384.

The SP500 also had an outside day by small margins, and a similar contour. But it did not achieve a new hi.

The NASDAQ has a clearly up day by small margins, and finished with a tiny gain.  It did not achieve anew hi.

The Russel 2000 had an outside day by small margins, with a similar contour to the DJI and SP500.  It is at the bottom of its channel, and well below its highs. 

Daily changes -
DJI30 -0.28%
SP500 -0.18%
NASDAQ +0.06%
Russell -0.48%

DJI Closings -
8/02/19 - 26485
7/31/20 – 26428
7/02/21 - 34786
8/02/21 – 34838

NYSE Internals -
A/D = 1549/1788 = 0.87
A/D Vol = 0.71
New Hi/Lo = 209/27 = 7.74


Wednesday, August 4, 2021

Red Arrow Down

DJI30 Index at the close   ---   34,792.67   -323.73 (-0.92%)

SP500 Index   ---   4,402.66   -20.49 (-0.46%)

The DJI opened at 35047, off 69 points, and immediately dropped, reaching a lo of 34895, off 221 within 15 minutes.  After a brief bounce, it dropped again, hitting the day's lo of 34790, off 326, before noon.  From there it galumphed along all afternoon into the close.  This is an inside day, with the hi lower by 74 points, and the lo higher by 76.  The span was 257, 150 points less than yesterday's 407.  

The SP500 had a clearly down day, with the hi and lo lower by 7 and 27 points, respectively.

The NASDAQ had a clearly up day, by 49 points at the hi and 150 at the lo.

The Russell 2000 had an inside day by tiny margins, but had the biggest percentage loss.  While the other indexes hover near their all time highs, the Russell is off its 3/15 hi by 11.85%

This was an erratic session, with the indexes not conforming each other.

% Changes - 
DJI30 -0.92%
SP500 -0.46%
NASDAQ +0.13%
Russell -1.23%

DJI Closings -
8/02/19 - 25718
8/03/20 – 26664
7/02/21 - 34786
8/03/21 - 35116

NYSE Internals -
A/D = 1085/2207 = 0.49
A/D Vol = 0.25
New Hi/Lo = 164/41 = 3.98


Thursday, August 5, 2021

Green Arrow Up

DJI30 Index at the close   ---   35,064.25   +271.58 (+0.78%)

SP500 Index   ---   4,429.10   +26.44 (+0.60%)

The DJI opened at 34816, up 23 points.  It rose quickly to 34980, slipped back a bit, then crossed above 35000 before 11:30.  It ran mostly sideways until 3:30, then rose parabolically into the close on a volume surge.  This is a clearly up day, by the small margins of 20 and 25 points.  The span was 252.  This is a nice recovery, but not enough to undo yesterday's damage.  Still, the Index is only a fraction of a percent under all time highs.

The SP500 had a similar contour, with a lesser gain.  It missed a new intra-day hi by a fraction of a point, and reached a new closing hi by 6 points.  It had a clearly up day by small margins.

The NASDAQ also had a similar contour, and an identical result to the DJI.  It reached new highs by 50 points intra-day and 58 at the close.

The Russell 2000 had a roughly similar contour, but hit its hi before 12:30, slipped back a bit, then matched it again at the close.  It was a clearly up day by about 3 points at both ends.  It was the day's big winner, and more than outdid yesterday's loss.

% Changes -
DJI30 +0.78%
SP500 +0.60%
NASDAQ +0.78%
Russell +1.81%

DJI Closings -
8/05/19 - 25718
8/05/20 – 27202
7/02/21 - 34786
8/05/21 - 35064

NYSE Internals -
A/D = 2241/1087 = 2.06
A/D Vol = 2.58
New Hi/Lo = 186/53 = 3.51


Friday, August 6, 2021

Green Arrow Up

DJI30 Index at the close   ---   35,208.51   +144.26 (+0.41%)

SP500 Index   ---   4,436.52   +7.42 (+0.17%)

The DJI opened at 35077, up 13 points, and quickly jumped up to 35247, up 183.  It stayed in a range between 35160 and that value until the close of the session, which ended on a rise of about 35 points on a late volume surge.  This is a clearly up day, with the hi and lo higher by 179 and 262 points, respectively. The span was 169.

With this gain, the DJI achieved new intra-day and closing highs by 55 and 64 points.

The SP500 also had a clearly up day, achieving a new intra-day hi by 11 points and a new closing hi 5.

The NASDAQ slumped until 11:00, recovered a bit after 1:00, then ran sideways the rest of the day. It had an inside day and registered a small loss. 
 
The Russell 2000 had a clearly up day, and its highest close in almost a month.  But it is still almost 5% under its 3/15 hi.

Each index took its own path today.  Make of it what you will.

% Changes -
DJI30 +0.41%
SP500 +0.17%
NASDAQ -0.40%
Russell +0.53%

DJI Closings -
8/05/19 - 25718
8/05/20 – 27202
7/02/21 - 34786
8/05/21 - 35064

NYSE Internals -
A/D = 1970/1316 = 1.50
A/D Vol = 1.70
New Hi/Lo = 183/35 = 5.23