Look: I am eager to learn stuff I don't know--which requires actively courting and posting smart disagreement.

But as you will understand, I don't like to post things that mischaracterize and are aimed to mislead.

-- Brad Delong

Copyright Notice

Everything that appears on this blog is the copyrighted property of somebody. Often, but not always, that somebody is me. For things that are not mine, I either have obtained permission, or claim fair use. Feel free to quote me, but attribute, please. My photos and poetry are dear to my heart, and may not be used without permission. Ditto, my other intellectual property, such as charts and graphs. I'm probably willing to share. Let's talk. Violators will be damned for all eternity to the circle of hell populated by Rosanne Barr, Mrs Miller [look her up], and trombonists who are unable play in tune. You cannot possibly imagine the agony. If you have a question, email me: jazzbumpa@gmail.com. I'll answer when I feel like it. Cheers!
Showing posts with label hydrocarbos. Show all posts

Wednesday, March 7, 2012

Has America Lost It's Drive? - Pt. 4

In Part 3 of this series, (at RB, at AB) I wondered a couple of things. 

- With the vehicle/1000 people number in the range of 825 to 845 since 2004, is the market near saturation?
-  Is the January sales number of 14.2 SAAR (seasonally adjusted at annual rate) enough to maintain the vehicle/1000 people number?

For the first question, I have to again credit Roger Chittum for pointing me to this 2007 paper, Vehicle Ownership and Income Growth, Worldwide: 1960-2030, by Dargay, Gately and Sommer (32 page pdf, data through 2002.)  There's a lot to this paper, including projections into the future for vehicle sales and fuel consumption, worldwide.   My immediate interest is in their use of a Gompertz function to estimate vehicle market saturation as a function of per-capita income.

Here is one of their graphs.

 Graph 1  Vehicle/1000 Gompertz Function of Per-Capita Income

Their model indicates flattening above about $30K per year, and leads to a saturation point in the U.S. of about 852 vehicles per 1000 population.  Saturation points for various countries also depend on urbanization and population density.  See the paper for details and background.

This indicates that the U.S market is about 97% saturated, give or take a point.

What does that suggest for vehicle sales going forward?   Karl Smith led off the month pointing to this graph from Calculated Risk, estimating light vehicle SAAR for February at 15.1 million.  With that, on to question 2.
 
I already have the data in hand for vehicles/1000 population (see part 3.)  The data for the Calculated Risk SAAR graph comes from BEA, Table 7.2.5S.  Plotting a scattergram of YoY change in Vehicles/1000 population vs annual average SAAR for the years 1990 to 2009 gives us this picture.  (See notes, below.)


 Graph 2   SAAR and Change in Vehicles/1000 Population

This suggests that the break even point for vehicles per 1000 is right around 14.7 million annual average SAAR.

The official vehicle/1000 numbers are only available up to 2009.  But we have the SAAR data for 2010 and 2011.  Annual average SAAR for 2010 is 11.77; for 2011, it's 13.05.  You probably don't want to take the values suggested by Graph 2 too literally, but seeing the vehicle/1000 number slip to around 815 for 2011 should be a reasonable expectation.  This is still slightly above the 95% saturation level.

Average light vehicle SAAR for the first two months of this year is 14.65 - right at the break even point for vehicles/1000 population.  

 Notes on Graph 2

The red dots represent data for 2001 and 2002.  The SAAR values look reasonable.  The changes in vehicles per 1000/population do not.  An increase of 25 in one year, from 800 to 825, followed by a decrease of 10 in the following year with SAAR, nearly identical (17.46 and 17.15) makes no sense.  An average of the two, plotted for both years as yellow dots, by some odd coincidence, lies exactly on the best fit line.

The R^2 value of .43 is less than stellar, but not terrible.

Eliminating the two questionable points raises R^2 to a respectable .65.

Cross Posted at Angry Bear.

Thursday, February 23, 2012

Is America Losing Its Drive? - Pt. 3 Vehicles per 1000 Persons

In private communication, Roger Chittum got me thinking about the vehicle component of gasoline consumption. I'm going focus on the gross vehicle numbers, and not get too deeply into the car/truck/SUV product mix detail.   Data is from the Department of Energy TRANSPORTATION ENERGY DATA BOOK: EDITION 30—2011.   (Warning:  414 page pdf.)

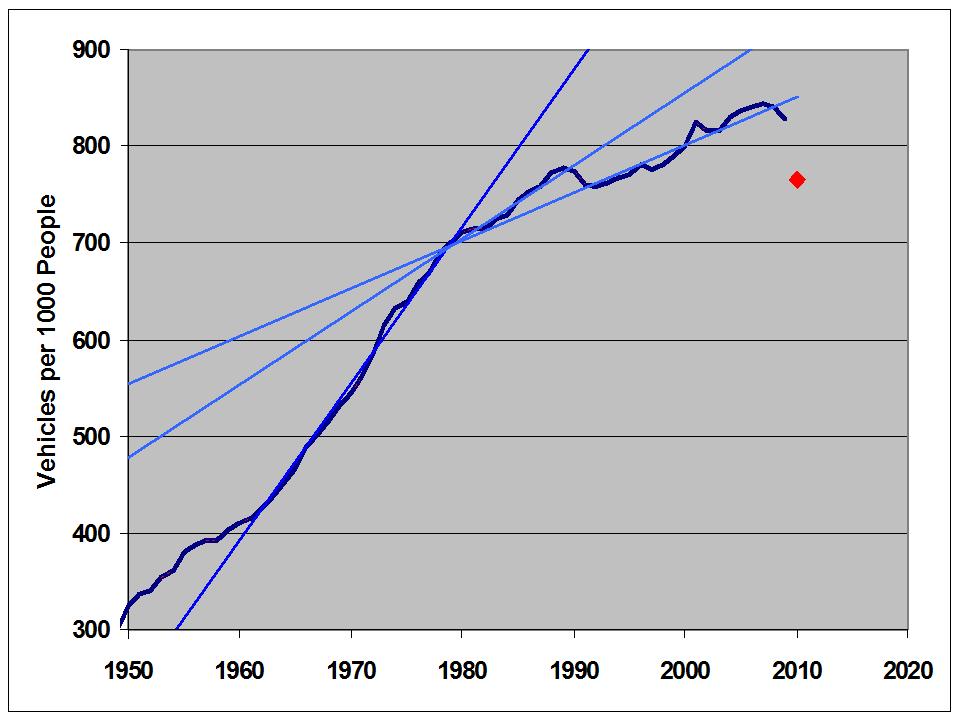
According to Table 3-5 on page 3-9, vehicle ownership, measured as vehicles (both cars and trucks) per 1000 population, peaked in 2007 at 843.57, and dropped by 1.88% to 828.04 in 2009, two years later.  Data presented in the source is from 1900 to 2009.  This graph shows the data from 1950 to 2009.  Recessions are highlighted in red.


During the post WW II era up to 1982, recessions might have slowed the growth of vehicle ownership, but they did not cause a decline.  Even the severe recession of 1958 only caused a flat spot on the curve.


This changed with the double dip recessions of 1980 to 1982.


The reduction from 1981 to '82 is miniscule.  But since then, every recession has led to a significant reduction from the previous year.  As an aside, this is one more time series that shows a change in character right around 1980.


This source indicates the most recent value for the U.S. is 765, though it's not clear what "most recent" means.  If this is accurate, then ownership has back-tracked to the 1994 level.   This would correspond to a 7.6% drop from 2009, and an astounding 9.3% drop from the 2007 peak.  I don't believe it; but that value is indicated with a red dot on the next graph, as a point of reference.

I've also included some best fit straight lines to show how the slope has changed over time.  The decreasing slope and more serious response to recessions might result from a market being close to saturation, but that's just a guess.


One of the reasons I'm skeptical of the red dot point is that new vehicle sales have recovered substantially from the 2009 low, as this graph from Calculated Risk demonstrates.  (The August, 2009 spike is the cash for clunkers event.)


This might not be enough to stop a continuing slide in the vehicles per 1000 population number, but I think it's enough to keep it from falling off a cliff.

Another perspective on vehicle use comes from Table 3.3 on page 3-5 of the Data Book.  This graph shows the Federal Highway Administration estimate of vehicles in use.


Except for recessions (highlighted in red on the total line) growth of the total vehicle count has been been quite constant over four decades.  But, since the mid 80's, car sales have been stagnant.  All of the growth since then has come from truck sales.  It will be interesting to see how these trends develop over the next few years.

Part 2
Part 1
Cross posted at Angry Bear

Wednesday, February 22, 2012

A Short Look at Vehicle Miles Driven

Doug Short digs into the same traffic volume data I looked at here.

He digs deeper and goes further, looking at miles driven per capita.

It's an interesting idea that I think has a lot of merit.

Check it out.

Bonus Links:

Here's Hale Stewart on the decline in gasoline deliveries.

Here is a convincing argument that demographics are a major part of the decline.

If I weren't so tired, this would probably make my head explode.

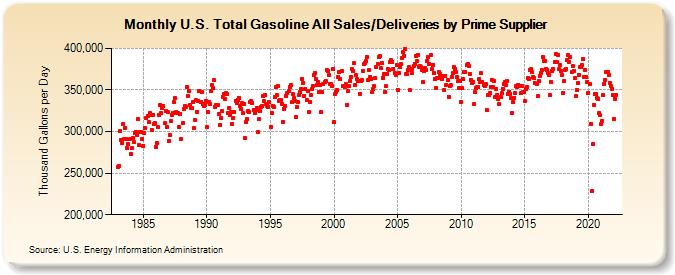
Best Gasoline Delivery Metric

Deliveries by Prime Supplier


Source.

Table of Details.

Roger Chittum did the leg work tracking this down.


Notorious

Seeking Alpha picked up my Drive post from AB. 

AB gets 7 to 10 thousand views per day, compared to the 50 to 100 I get here.*

SA is in the tens of thousands per day, at least.

Drive 2 was linked by Calculated Risk, a prominent econ blog.

I am become Notorious.

___________________________________
 * A distressing number of whom are from foreigners looking for naked pictures of Sienna Miller.


Tuesday, February 21, 2012

Has America Lost its Drive? Part 2

I made a mistake in my original post  (Cross-posted here at RB.)   Graph 4 in that post was based on the wrong data set.  As Roger Chittum pointed out in comments at AB, that graph only covers a subset of total gasoline deliveries.

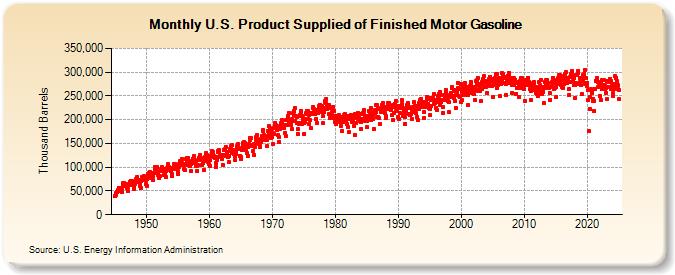
This is the correct graph.  (Source.)  Thanks, Roger!


Graph 1 Gasoline Supplied

The fall off in gasoline delivery is not as extreme as I indicated, but it is still real.  Here is a close-up view of data for the current century, from the same source.


Graph 2 Gasoline Supplied This Century

Seasonal changes are dramatic.  Peaks occur in July or August, valleys in January or February of most years.  May values, highlighted with blue dots, and September values, highlighted with yellow dots, are recurring secondary peaks and valleys, respectively.  July values are highlighted with red dots.  The years 2008 and 2010 are accented with contrasting blue line segments.

In 2008, gasoline consumption dropped dramatically.  May was down slightly, compared to '07, while July and September were down a lot.  Through 2009 and '10 there was a slight recovery, with all three highlighted months showing increases.  The 12 month moving average, in pink, stopped falling, but failed to increase very much.

Monday, February 20, 2012

Quote of the Day - Carbon

The most affordable and politically possible way to deal with coal may be to buy the mines and turn them into parks because anything else that comes close to making coal uneconomical will result in massive, protracted litigation about compensation for a "regulatory taking." The whole legislative conversation about markets, offsets (preserving rain forests, etc.), and carbon capture and sequestration ("CCS") grows out of the fantasy that we can achieve adequate CO2 emissions reductions without shutting down all coal mines and closing many refineries. We can't. Deal with it.
-  Roger Chittum

Roger's reality-based views are always worth a read.  Check it out.

Friday, February 17, 2012

Has America Lost it's Drive?

Yesterday,  Karl Smith posted on Oil and the Structural Recession.  This seems to be one of Karl's thinking-out-loud posts, with more questions than answers, some convoluted reasoning, and a conclusion that higher gasoline prices are in our future.  If I read him right, this will be due to a demand pull.

He included this graph from Calculated Risk.


Graph 1.  U.S. Vehicle Miles

The number of miles driven tends to flatten during a recession, then recover quickly when the recession is over.  At least, that's the way it used to be.  The Miles Driven curve seems to have been losing slope since the late 90's, and was close to flat-line during the housing bubble last decade, when everyone supposedly felt rich.  There has been no recovery after the recent Great Recession, which officially ended 32 months ago.

 The same CR post cited above also includes this graph.


Graph 2.  YoY Change in Vehicle Miles

This confirms my eye-ball assessment that the slope in the first graph has been in decline since long before the oil price bubble of recent years.

But here is a contrary development.  Calculated Risk also reports that the truck tonnage index is way up for all of 2011, and especially in December, when it posted an all time high.


Graph 3. Truck Tonnage Index

Truck traffic is way up, but total miles driven, per graph 2, has been mostly in decline for four years.

This suggests that discretionary personal driving has been sharply curtailed.  I'm having a hard time coming up with any alternative explanation.  Can anybody suggest one?

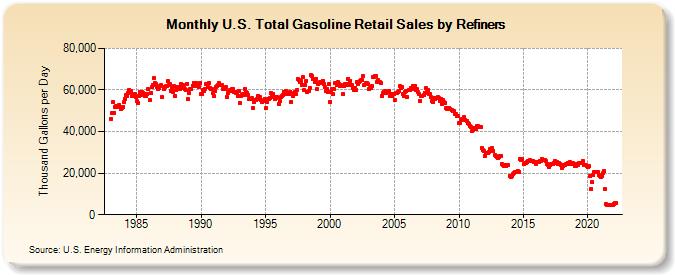
Just in the last couple of months, it seems that discretionary driving has taken a deep plunge that has not yet shown up in the data posted above.  Deliveries to retail gas stations have been slumping for well over a decade, and now have fallen off a cliff.  If gasoline delivery is just-in-time, as I believe it is, then deliveries are an excellent proxy for consumption.

By the Way, improved fuel economy cannot account for more than a small fraction of this change.  The big improvements in fuel economy happened during the 80's, when fuel deliveries were in an upswing.  Since 1990, fuel economy improvements for the actual fleet on the road have been on the order of 0.5% per year.


 Graph 4.  Gasoline Retail Deliveries

I made my own graphs of the retail delivery data (not posted,) and there is, surprisingly, no particular response to the recessions of 1991 and 2001.  It's not easy to find any recession on Graph 4.  Deliveries were slumping even before the Great Recession, so whatever effect it might have had on its own was subsumed by the general trend.  The above graph is noisy, due to lack of seasonal adjustment.  The lowest row of dots over most of this graph represents January data.  Summer months cluster at the top of the array, as you would expect.  Those two lonely points in the lower right corner are October and November, 2011, the most recent data shown.

It's remarkable that gasoline deliveries are now substantially lower than at any time available in this data set. spanning about 30 years.  And I would never have guessed that anything like this was happening, based on my many trips on I-75 between Detroit and Toledo.  That route must not be a representative sample.

In a comment on Karl's post, I said that I see all petroleum prices as highly manipulated on the supply side, with demand as a follower.  This data makes me think that the same is true of gasoline, in particular.  But it can't be the entire story for the decline in consumption.  There is no clear connection between deliveries and gasoline prices over the last several years.

I don't know where gasoline prices are going.  Karl might be right that they are going up.  But I don't see any way that this can be due to a demand pull.

Mish also has a couple of recent posts relevant to this topic.

H/T to commentor rjs at Karl's post, who got me thinking about this, and provided a key link.

Cross-posted at Angry Bear.

Update:  This post got picked up by Seeking Alpha.

Thursday, May 19, 2011

No Speculation About Oil Prices

I think I can show that oil prices are not behaving in a completely supply-demand determined way.  We'll look at price activity, volatility, and an estimate of what rational pricing might be.

First, here is Brent Crude spot price activity since 1987, data from the U.S Energy Information Administration.  I've taken a weekly average of daily data, and plotted it as of each Friday (it was just a lot easier than trying to work their data table into a daily data plot.) Also included is a 55 week moving average.


As you can see, the price really took off after 2000.  Coincidentally, the Gramm–Leach–Bliley (Financial Services Modernization) Act of 1999, which undid portions of the Glass-Steagall of 1933, was signed into law on Nov 12 of that year, and the Commodities Futures Modernization Act of 2000 was signed into law on Dec 21 of that year.  These new laws allowed mega-consolidation in the finance industry and prohibted the regulation of certain speculative activities.

Here is the same data, separated into two graphs around the year 2000.  Also shown are the 55 week moving average, and an envelope one standard deviation above and below the average.  St Dev is based on the same 55 data points as the moving average.  The sections of the price line that extend above the {Avg + St Dev} line are highlighted.


The entire data set contains 1166 points.  Of these, 428, or 36.7%, lie more than 1 Standard deviation above the moving average.  For the segment through 1999, 156 of  574 points, or 27.18%, lie above the St Dev envelope.  For the segment 2000 on, 227 272 of 592 points, or 45.95%,  lie above the St Dev envelope.

For data normally distributed around the mean, about 1/3 of the data points should lie outside the 1 St Dev envelope, half above and half below.   I'm no statistician, but this is not a well behaved data set.  Clearly, there is a powerful high-side bias.  What could be the cause?  Here are some possibilities.

1) Supply-demand forces in a growing world economy are so skewed to the demand side that this is that natural result.
2) External forces, such as panic due to war and instability in the Middle-East, have irrationally raised prices.
3) Speculative forces with a strong long-side bias have skewed the market away from a supply-demand determined price level.
4) Withheld supply due to OPEC activities, contango (hoarding on leased tankers), and the disruption of Iraqi supply for the last decade have unnaturally skewed the supply component.

My view is that possibilities 2 - 4 are all operating to some degree.

I have no way of evaluating 2 and 4. However, 4 seems reasonable, in view of the classic description of inflation: too many dollars chasing too few goods.  This effect could also spill into into futures speculation, where the amount of oil traded is finite, but the amount of speculative money available appears not to be.

Update:  To be clear, I'm not talking about CPI inflation, I'm talking about commodity-specific inflation.   I believe that financial tail-chasing has not been limited to oil speculation.  There is enormouse wealth in the world, and to a large extent, it is not being devoted to legitimate investment.  It is being devoted to computer generated program tradign that skims tiny fractional percentage gains thousands of times per day to skim money away fro tose who use eschanges for valid purposes.

And maybe we can get a handle on speculation.  My hypothesis is that deregulation in the 1999-2000 time frame has enabled and encouraged speculative rent-seeking activities in the oil futures market, which has inflated the price of crude.  One way to go at it is to have a look at volatility.  We already have standard deviation in our hip pocket.  Let's see what we can do with it.

Here is standard deviation, based on 55 consecutive data points, divided by the average of those data points.  Just for kicks, included are a 55 point moving average of the St Dev in red  (for what it's worth -  not much, I'd say) and a best fit (least squares) trend line. 


Well - the trend line slopes up a bit, but that's not really a lot to go on.  On the other hand, the entire 90's lie below the trend line.  In fact, except for the 1990 price spike, most of the of the St Dev values prior to about 1999 lie below the trend line.  Let have a closer look.

Here, the data are divided into two segments,  up through 1999, and 2000 and beyond.   For the early segment, the St Dev/ Price line is in dark blue and the 55 week average is in red.  For the latter segment, the lines are light blue and yellow, respectively.  Now, the trend lines tell an interesting story.  For the early period, the trend line is essentially flat, with a slight downward slope.  For the latter period, the slope is clearly upward.  Despite the localized gyrations, we can see that prior to deregulation, volatility had no trend.  After deregulation the trend is up.


Up to 1999, St Dev / Price averaged 12.65% (exclusive of the 1990 spike, taken as August, 1990 through January, 1991 the value is 12.01% )  From 2000 until now, the St Dev / Price averaged 15.06%.

So, what we see is that since since deregulation, prices have gone up, volatility has gone up, and upside bias in the data set has gone up.  Let's resurrect possibility 1) and see if demand pressure can be the cause.  To get a handle on this, I took a closer look at my speculative idea from the previous post, and extrapolated prices forward from 1990, based on hypothetical constant growth rates.  Originally, I took a SWAG at the 1990 average price, and came up with $30 per barrel.  With a growth rate of 4% over 21 years, that would result in a current price of $68.36.  The 4% growth rate came from a generous estimate of World GDP growth over the period, assuming a direct, linear link between GDP growth and demand for petroleum.

Here is a graph based on the data instead of a SWAG.  It shows constant price increase rates of 3, 4 and 5% per year, based on the actual 1990 average price of $23.66.  The first thing to note is that my $30 SWAG was more than $6 too high.  The next thing to notice is that 1990 was the worst possible year to select, given the point I'm trying to make.  Due to the local spike, the 1990 average of $23.66 is almost $5 higher than the 1987 to 1993 average of $18.84.  So, if anything, my estimate of $68.36 is artificially high.

Still, I went with the 1990 average for this chart.  Extrapolations are based on growth rates of 3 (yellow), 4 (red) and 5(green)% from the 1990 average of $23.66.  This gives current price estimates as follows.

At 3%   $43.34
At 4%   $53.02
At 5%   $64.09


I'm not suggesting that this is a fool-proof method.  However, it is gratifying that it is more-or-less consistent with the oil industry estimation of a supply-demand determined price.  Further, these price growth estimates are quite generous, since estimates of petroleum demand growth are in the range of 1.6 to 2.3 %.

My conclusions:
1) The price of oil is far above rational, market-based pricing.
2) While other distortions and manipulations are likely to play a part in an inflated price, it's not clear how they could contribute to increased volatility.
3) Unregulated, excessive speculation, with a long side bias is indisputably taking place.  I believe this is a major contributor to excessive price inflation, and the sole contributor to excess volatility.

Do you have a better idea?  Let's hear it.
.

Wednesday, May 18, 2011

Speculation About Oil Prices

Some of the crazed Democrats and  liberals (Ed Schultz and Bernie Sanders spring readily to mind) who have somehow resisted the enlightenment of unfettered free markets now have suggested that high oil prices are  due to speculation.

Noah Smith took this subject on recently, asking the question: "Do speculators cause oil and/or gas prices to rise above their "natural" or fundamental level?"   I left a long, thoughtful comment, which evidently evaporated in the Blogger glitch (aka "Blitch") that happened around that time.  Alas, it is gone forever. Noah's take is that speculation is innocent, and he cites some corroborating experimental evidence.

This, however is missing the point, I believe.  First, I'll state right up front that futures markets play a vital role in allowing the producers and first-line purchasers of various commodities to be able to stabilize their cash flows and construct realistic business plans.  So - yes, futures markets are a good thing.

On the other hand, when quizzed by Senator Cantwell last week on why big, trans-national oil companies should continue to receive multiple billions of dollars in tax breaks, Exxon CEO Rex Tillerson admitted that a good estimate of a supply-demand determined price (considering the price of the next marginal barrel)  for crude is in the range of $60 to $70 per barrel.


For reference, here is a chart and data table for Brent crude, going back to 1987.  At the depth of the global recession, on Boxing Day 2008, when the world was coming to an end, the price dipped below $34.  Be that as it may, with recent prices in the $110 to $120 range, we're looking at premiums over a rational value estimate of from 57 to 100%.   Let's just call it 75% for convenience.

Now, back to the point that Noah misses, and that Senator Cantwell suggested.  What is the effect of unregulated speculation on the price of oil?  The Senator estimates 30% activity by concerned stake-holders, and 70% by profit-seeking (in my view rent-seeking) speculators who are after a quick and easy buck.  This financial tail chasing, aided and abetted by deregulation and frankly regressive tax policy, is a direct manifestation of the asset misallocation that, in my view, is the real cause of The Great Stagnation.

A look at the oil price chart shows 10 to 15 years of more-or-less flat line in the range of $20, followed by a classic bubble and post bubble bounce.  (As an aside, this is typical Elliott wave behavior.  I can easily trace a five wave rise to the peak, and what looks like the recent end of a counter-current B-wave since the Dec. '08 bottom.  If this is anywhere near correct, the price of crude a decade from now will be eye-poppingly low, and fundamentals be damned.)

But let's look at fundamentals, anyway.  Global GDP growth since 1980 has been in the range of 2 to 5%.  Let's generously call it 4%.  (Interestingly, it was much higher in the 60's and 70's - hmmmmm . . .)  The price of crude in 1990 varied from about $15 to $40.  Let's generously call it $30, on average.

If we compound $30 at 4% for 21 years we get (are you ready for this) $68.36.  And this is based on generous numbers.

Not a rock-solid price algorithm, for sure, but I think it easily passes a laugh test.  Maybe it's just a coincidence that this number corroborates Rex Tillerson's off-hand estimate.

Maybe it's another coincidence that oil prices took off after Phil Graham pushed through legislation (signed by Billy-Bob Clinton at tail end of his battered term) that eliminated regulations from speculative trading.  One of these is removing this requirement "Either way, both the buyer and the seller of a futures contract are obligated to fulfil the contract requirements at the end of the contract term."  In case this is not crystal clear, it means that a contract  must be closed by executing the opposite transaction from the original prior to expiration, to avoid either supplying or receiving the physical amount of the contract - unlike any other commodity future.

Maybe it's another coincidence that Morgan Stanley became the largest oil company in America.  Oh - another point that Noah explicitly missed is that big, speculative finance entities did, in fact engage in physical hoarding.  Here is a 13 month old news flash.

Oil traders are taking advantage of a market condition known as contango, in which the price for future delivery is greater than the price for spot (immediate) delivery. If the difference between the two prices is more than the cost of chartering an oil tanker, traders stand to profit. The difference between the price of crude oil for June delivery and the price of crude oil for July delivery is more than $2.00 a barrel; that’s enough to defray the cost of chartering a very large crude carrier (VLCC), which holds about 2 million barrels of oil and, as of April 23, cost $43,876 per day, according to the Baltic Exchange.

How much of an incentive to keep prices artificially high do you suppose is provided by a cost of $43,876 per day?  That's $1.31 million per month.

And that's why I think Ed Schultz, Bernie Sanders, and Maria Cantwell are a bunch of damned fools!
.

Friday, April 1, 2011

What the Hell?!? Friday - "Transocean Cites Safety in Bonuses " Edition

I know it's still April Fool's Day, but the WSJ has this item pre-dated April 2.

Rachel just mentioned this and it took about 5 seconds to locate it using TEH GOOGLY.

In case you need to be reminded, Transocean is the company that was running the BP oil rig that exploded last April 20, killing 11 people instantly and several hundred miles of shoreline in a rather more leisurely fashion.  The fate of several thousand people along the shore is decidedly uncertain.

Transocean Ltd. had its "best year in safety performance" despite the explosion of its Deepwater Horizon rig that left 11 dead and oil gushing into the Gulf of Mexico, the world's largest offshore-rig company said in a securities filing Friday.
 .   .   .
The payout contrasts with that for 2009, when the company withheld all executive bonuses after incurring four fatalities that year "to underscore the company's commitment to safety."

In a filing on executive pay, Transocean said, "Notwithstanding the tragic loss of life in the Gulf of Mexico, we achieved an exemplary statistical safety record." Based on the total rate of incidents and their severity, "we recorded the best year in safety performance in our company's history."

I don't think there is anything I could say that would make this better.

I don't think there is anything I could say that would make this worse.

Really.  Vocabulary fails me.
.

Sunday, September 5, 2010

Iraq War Costs

Stiglitz and Bilmes reimagine the true total cost of the Iraq war at something north of $3 Trillion.

Their estimate is far too low.

Oil

When the United States went to war in Iraq, the price of oil was less than $25 a barrel, and futures markets expected it to remain around that level. With the war, prices started to soar, reaching $140 a barrel by 2008. We believe that the war and its impact on the Middle East, the largest supplier of oil in the world, were major factors. Not only was Iraqi production interrupted, but the instability the war brought to the Middle East dampened investment in the region. 

In calculating our $3 trillion estimate two years ago, we blamed the war for a $5-per-barrel oil price increase. We now believe that a more realistic (if still conservative) estimate of the war's impact on prices works out to at least $10 per barrel. That would add at least $250 billion in direct costs to our original assessment of the war's price tag. But the cost of this increase doesn't stop there: Higher oil prices had a devastating effect on the economy.

I'm astounded by their meekness.  Attributing only $10 of the oil price to the war is absurdly low - possibly by an entire order of magnitude.   So - their $3 Trillion guess is low by - very conservatively - another trillion, and quite possibly 2 or  even 3 trillion.  The current crude price of $74.34 is probably still above rational evaluation by 50%, or more.  A steady, but objectively extravagant 15% year over year increase from 2002 to now would result in a crude price of about $76.50.   A more realistic increase of 8% would leave it at $46.27.   There is a lot of room on the down side.

The price movement has followed a classic bubble pattern, and it's not at all hard to put Elliott labels on this chart   (as I have done below) and project crude prices around $30 in the next few years - especially if there is a double dip recession and actual deflation.


But there is also a great deal of destabilization in the Middle East, and increased Muslim militancy caused by this war that Stiglitz and Bilmes neglect to mention.  Each of these will have high economic and human costs far into the future.

The Iraq war is the most misbegotten foreign policy adventure in U.S. history.

H/T to AB

Tuesday, July 20, 2010

Oil and Water Do Mix . . .

. . .  at the parts per million level.

To put this in perspective, New York city has a population of a bit over 8 million.   So, if 8 illegal immigrants from, say Iceland, scattered in New York City, their concentration would be about 1 ppm.

Not a lot, unless each of them is toxic.  Then who knows what might happen?

Maybe they'd all go to the beach.


WKRG.com News

Via HuffPo.

H/T to the Lovely Wife.
.