Look: I am eager to learn stuff I don't know--which requires actively courting and posting smart disagreement.

But as you will understand, I don't like to post things that mischaracterize and are aimed to mislead.

-- Brad Delong

Copyright Notice

Everything that appears on this blog is the copyrighted property of somebody. Often, but not always, that somebody is me. For things that are not mine, I either have obtained permission, or claim fair use. Feel free to quote me, but attribute, please. My photos and poetry are dear to my heart, and may not be used without permission. Ditto, my other intellectual property, such as charts and graphs. I'm probably willing to share. Let's talk. Violators will be damned for all eternity to the circle of hell populated by Rosanne Barr, Mrs Miller [look her up], and trombonists who are unable play in tune. You cannot possibly imagine the agony. If you have a question, email me: jazzbumpa@gmail.com. I'll answer when I feel like it. Cheers!
Showing posts with label confusion. Show all posts

Friday, September 20, 2013

The Misguided Right Wing

One of my friends invited me into a FB debate on BHO.  There is certainly a lot to criticize in this administration, but very little real opportunity to legitimately criticize from the right.  This, I believe, accounts for a lot of the birtherism, and Muslim-Commie-socialist-fascist nonsense.  With few legitimate complaints, they just make $h!+ up.

Even without getting into wing-nut fantasy land, there is a lot the right wingers simply know about BHO and how he has ruined America that simply does not stand up to the harsh light of reality.  They blame on Obama things that have been going on since Reagan.  They blame the "left" [which is laughable - there is no political left in this country] for the actions of the Rethug dominated house.   The simple fact is, their minds are made up.  They will only hear things that reinforce their views, and contrary facts will only make them dig their heels in harder.  This is epistemic closure, aka DERP.

To an extent, this is human nature.  We all love our revealed truths and most cherished concepts, no matter where they came from. But open mindedness is a specifically progressive characteristic. None of us is immune to derp, but it is inherently more deep and pervasive among those who call themselves conservative, but are in fact regressives.  Reading a bit of Russell Kirk and my own observations have convinced me that the four pillars of conservatism are ignorance, prejudice [these come directly from Kirk - and he's proud of it!], denial of reality [global warming, New Deal Denialism], and magical thinking. Conservatives generally seek simple solutions, can't be bothered with complexity, and grasp at cleverly framed right wing talking points.  This all by itself accounts for the popularity of the Reagan mythology.  And these are the GOOD conservatives.  Tea Bagging Regressives are far, far worse.

You can argue until eternity with regressives, but you can't set them straight, because they will have none of it.  A Progressive, when confronted with new data, changes his opinion. A Regressive, when confronted with new data, changes the data.

Or simply ignores it

Regressives blame Obama for a variety of real and perceived ills.

Ruining the value of the dollar.
The trade weighted dollar index declined over 30% under W, then gyrated during the Great Recession.  Since then it has been dead flat.  Still, It's Obama's fault.


Graph 1 - Trade Weighted U.S. Dollar index

Decreasing the median income of households.

This has been going on since Reagan.  In nominal dollars, the rate of increase in median household income was lower under Bush II than under Reagan and Clinton, and has been flat since the recession.  Inflation adjusted, household income has zig-zagged to nowhere since the 70's.  The two most recent increases occurred first, and dramatically, under Clinton, and then only a bit from 2004-2007 during the housing bubble.  Recessions in '91, '01, and '08 have been devastating. The trend from 2000 on has been steeply down.


Graph 2 - Real Median Household Income

Income Data from the U.S. Census Bureau, Table H-8.  Inflation data from FRED

But to blame the recent decline on Obama rather than the decades-long assault on the middle class we call Reaganomics, the destruction of American manufacturing during the Bush regime, and House Tea Party Rethug obstructionist efforts to shut down the goverment and impose arbitrary debt ceilings takes a type and degree of blindness that simply cannot be penetrated by any wavelength of light.

Ballooning the debt

I've already put several stakes through the heart of the zombie idea that Obama is spending us into perdition - here, here, and here.  If you seriously believe that we have a debt problem due to Obama's spending, then please take the time to read and understand these three posts.

The debt results from a ledger imbalance, and both spending and revenues come into the equation.  Since the Recession ended, government spending at all levels is down.  Federal spending is dead flat and state and local govt spending is dead flat.


Graph 3 - Government Debt

Federal Debt annual growth ballooned to over 20% early in Reagan's first term, and was never less than 10% per year during his presidency.  It dropped every year under Clinton, who ran a surplus at the end of his term.  Under Bush, it was never less than 5% per year and peaked first at 10% in 2004, then over 20% in Q1, 2009.  Strangely, nobody on the right was complaining about debt growth when there was a White Rethug in the White House, and V.P. Cheney famously said, "Deficits don't matter." Which is true, as long as the Rethugs are in control.  During Obama's entire term, debt growth has been on the decline.


Graph 4 - Year over Year % Growth in Federal Debt

But debt is still growing - only at a slower rate.  If spending isn't the cause - and clearly, it isn't, then inadequate revenues have to be.  And they are.  This comes from two factors.  First, slow income growth and business activity leads to slow growth in tax revenues. We're living through the worst recovery in at least a century.   Second, tax receipts are inhibited by tax rates and policy decisions.  All things considered, progressive taxation on personal income is close to non-existent, and collections from corporations are deeply depressed because of loopholes and off-shore evasion gimmicks.  The right wing talking points that we are overtaxed and this taxation inhibits growth are simply lies.

Decimated our Credit Rating

Moody's reaffirmed U.S. debt at AAA rating in July, and upgraded  the outlook for government debt to stable from a negative watch.  Danger to our credit rating comes from Rethug debt ceiling and government shut-down threats.  But now, if our credit was bad, the interest rate on federal debt would be soaring.  It's up from about 2.6% to 3.75% since last summer, but about where it was two years ago.  This is just market fluctuation in a trend channel.  Except for a dip during the Great Recession lower, the interest rate is lower than at any other time since the 60's.


 Graph - Interest Rate on 30 Year Government Bonds

 This is just a bit of the nonsense my friend's friend spewed forth in an ignorant, but passionate, anti-Obama rant.

What took him a few seconds to blurt has taken me hours to refute.

This is why simple lies always have an advantage over the truth.

And then, the liars and their fellow travelers just move along to the next talking point.

We are so screwed. 

Wednesday, September 11, 2013

Money Makes Dhe Vorld Go Around

Update:  Do NOT read this post.  It's a massive screw up.


But not if it's buried under a rock, or in it's nearest equivalent, a secure bank vault.

Graph 1 shows some aggregate money measures, along with excess reserves, the aptly named EXCSRESNS.

Graph 1 - M Aggregates and Excess Reserves

EXCSRESNS is placed on the right hand scale, because otherwise you have Graph 2, with all the aggregates flat-lined at 0, to a reasonable first approximation.


Meanwhile money velocity is dying a slow and agonizing death.

Graph 3 - Velocity of MZM

The Federal Funds rate has been at or below 0.20% for four consecutive years.  Add on a few rounds of QE, and you get this amazing success: unemployment now down to about the level of previous peaks.

Graph 4 - Unemployment Rate (blue)and U 6 9red)

And this is accompanied by the worst out-of-recession Real GDP growth in the history of ever.

Graph 5 - RGDP, YoY % Change

Of course, runaway inflation remains a clear and present danger.

Graph 6 - CPI, YoY % Change

Then, again, maybe not.

OK, Market Monitarists, what is the FED supposed to do?

Oh - I know - NGDP targeting.

If the Fed determined that NGDP should rise at 5% per year, businesses and households should behave with the expectation that their incomes will rise 5% each year, and by behaving in such a way they thereby generate the 5% increase. Of course, not everyone's income will rise by 5% just as not everyone's prices rise 2%. But aggregated across the economy, these decisions should produce the desired outcome for the national economy.

What is this?  Hand waving?  Dog wagging?  The almighty invisible hand?  Wishing can make it so?

Expectations, right?

People in households with flat nominal and declining real incomes are supposed to act as is they expect a 5% raise this year, and that behavior will generate real growth. 

But Winter is coming and the wolves will be hungry.  How long is that supposed to last?

Besides - do you think that most ordinary struggling people have any knowledge of what the FED is, let alone some way to modify their expectations based on tongue wagging and ineffective policy actions they are, at best, only dimly aware of?

Seriously - what is the transfer mechanism?

Friday, March 29, 2013

WTH?!? Friday, Ridiculous Facebook Thingie Edition

This is just too rich


The wonderfully hilarious thing about this is THAT THERE IS NO BIBLICAL DEFINITION OF MARRIAGE!   And - even better - in the Old Testament, a man could have multiple wives.

And isn't the point of the New Testament that it rendered the Old Testament obsolete?  Isn't that changing the laws of God?

But if you think not, then well -- as for those immutable laws - spend a little time with Leviticus and tell me how you feel about that.

Meanwhile, marriage is between one man, one woman, plus possibly her sister, and for sure his brother's widow, should such an opportunity arise.
 
Conservatives have no sense of irony, but I am forever wedded to mine.


Wednesday, September 26, 2012

The Effect of Capital Gains Tax on Investment - Appendix

In comments to my previous post, Robert requested the unsmoothed data from Graph 3.  Here it is.   GPDI is plotted against the Capital Gains Tax Rate.


Since the Capital Gains Tax Rate (X-axis) is quantized, the result is columns of data.  Compared to the smoothed version, there is little change in either the slope or intercept of the best fit straight line.  R^2 is, of course, much lower.


Tuesday, September 25, 2012

The Effect of Capital Gains Tax on Investment

Matt Yglesias, servitor to our corporate overlords, suggests that the reduced capital gains tax rate paid by rentiers like Willard Romney is really a very, very good thing.  To wit:

The main reason Romney's effective rate is so low is that the American tax code contains a lot of preferences for investment income over labor income.
. . .
But this is definitely an issue where the conservative position is in line with what most experts think is the right course, and Democrats are outside the mainstream.
.  .  .
That's the theory, at any rate. It's a pretty solid theory, it's in most of the textbooks I've seen, and it shapes public policy in basically every country I'm familiar with. Even researchers like Thomas Piketty and Emmanuel Saez (see "A Theory of Optimal Capital Taxation") who dissent from the standard no taxation of investment income position think capital income should be taxed more lightly than labor income. Empirically, it's a bit difficult to verify that variations in capital gains tax rates and the like really are making a material difference to investment levels. But then again the data is noisy.

Scott Lemieux at LGM demurs.

Sure, if you 1)accept the premise that reducing or eliminating capital gains taxes will result in productive infrastructure investments rather than worthless accounting tricks, 2)ignore the economic benefits created by consumption, 3)assume that significant numbers of people will forgo money for doing nothing just because the profits will be taxed , and 4)ignore the fact that in most jurisdictions consumption is also “double taxed,” then reducing capital gains taxes looks good.   But since all of these assumptions are (to put it mildly) highly contestable, it’s just question-begging.

My response to Matt is that in my jaundiced opinion, you might as well consult The Necronomicon of Abdul Alhazred as an economics textbook for an issue like this; and that in a world that has on the one hand Krugman, Thoma and Delong, and on the other Fama, Cochran and Cowan, a consensus among experts is about as likely as lions lying down with lambs for some purpose other than a quick snack.

To Scott I say, why assume or ignore anything when that oh-so-noisy data is readily available?

Friday, September 7, 2012

Why Spending/GDP is a Terrible, Horrible, No Good, Very Bad Metric For Judging Obama's Performance

A post like this really shouldn't be necessary, but part of the right wing canard that Obama has been a profligate spender is based on spending as a percentage of GDP.

It looks like this - Graph 1.


Graph 1.  Fed Expenditures/GDP

Sure enough, by the end of Clinton's term the ratio had fallen from Reagan's high of 24% to a modern low of 19%.  But note that the 19% value wasn't typical.  It was the end point of a decade-long decline.  And, yep, there's Obama with an all-time-high approaching 26%.

What otherwise intelligent, and sometimes even famous people seem to ignore though, is that every ratio has not only a numerator but also that ol' devil denominator.   Let's have a look at both of them.  Graph 2 shows GDP and Expenditures since 1980, expressed in $ Billions.  I've also added a line representing 5* Expenditures, since 20% of GDP is a reasonable rough estimate for the post WW II era.


Graph 2.  Expenditures and GDP Compared

Actually, the 5x Expenditures line runs pretty consistently above the GDP line, telling us two things that we should have already known from looking at Graph 1.  First, Expenditures greater than 20% of GDP have been the norm since before 1980, and 2) Clinton's final number is not representative of anything other than a single year.  Using it as a comparator is cherry-picking and fundamentally dishonest.

The 5x line also emphasizes that the majority of the spending increase under Obama unavoidably occurred during the officially designated recession.  The GDP line shows that, post recession, GDP growth has not recovered to the pre-recession trend line.  In fact, growth has established a new trend line with a lower slope.  This is unprecedented in the scope of FRED historical data.  My guess is that insufficient Federal spending has been a big drag on this recovery.  But it's also true that GDP growth has been in secular decline since the Reagan administration.  Note that skewing the denominator down will automatically skew the ratio up.  This is what Bill Clinton calls "arithmetic."

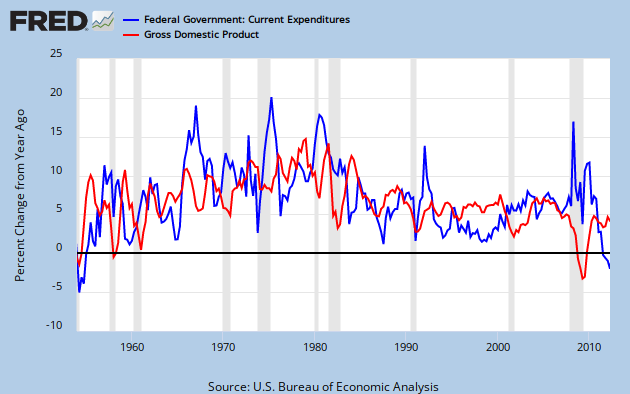
Slicing across this a different way, Graph 3 gives us year-over-year percentage growth in Expenditures and GDP, dating back to the Eisenhower administration.


Graph 3.  YoY % Change in Expenditures and GDP

A few simple observations:
- The spending increase during the recent recession was modest by any standard, and dwarfed by earlier surges.
- That increase, coupled with the most severe GDP decline since the other Great Depression gave our beloved ratio a terrible, horrible, no good, very bad double whammy.
- GDP growth during this recovery is only marginally better than it was during the 2001-2 low, and far below Clinton era levels.
- Clinton was the most consistently frugal president of the post WW II era - until now.
- Since the recession was declared over, B. Hoover Obama has been miserly.

One can legitimately argue that Obama's approach to the economy has been excessively conservative.  Krugman has made this point repeatedly.  I often say that Clinton governed to the right of Eisenhower - who was a genuine deficit hawk - and that Obama is to the right of Clinton. That is intended to be slightly hyperbolic, but using this data as the benchmark, it's dead on.

Any questions?

Cross posted at Angry Bear

Tuesday, January 17, 2012

Huntsman Endorses Romney

John Huntsman is throwing in the towel, after consistently polling in the low single digits.  (Eschewing an obvious joke here.)

Now he endorses Mitt the Ripper.   Propitious flip-flop?  You be the judge.


Friday, December 30, 2011

Say's Law and Ricardian Equivalence

I'll admit I get a bit confused thinking about Say's Law and Ricardian Equivalence - which I never do, unless actually reading about them somewhere.  But the kerfuffle between Krugman and Lucas has been pretty hard to ignore.  (Each of them is confused as well - or not - depending on whom you chose to believe.)  You can read about it in many places.

What Lucas said.

What Krugman said.

Econospeak

Macromania

Noahpinion

At Noah's place I launched into a reality based critique of Say's Law.  Though it turns out not to have been quite Say's Law, after all.  Like I said, this kind of B.S confuses me.  Still, I think I've given a valid criticism of some aspect of conservative economic thought. 

you can't get around Say's Law by taxing people in the future instead of today, because people are forward-looking and have rational expectations

If Say's Law were not invalidated for other reasons, it would absolutely fall apart here.

Have you ever heard anybody ponder what they would be doing with their money 5 or 10 years down the road if they didn't buy a big screen TV today?

Does anyone ponder relative poverty in their old age vs taking a vacation now?

To the extent that most people think about money at all, it's implicitly in terms of cash flow. Can I make the finance payments on this purchase and still afford to feed my cat? This is the real wold, which is apparently terra incognita to economists.

Plus, rational expectations is the silliest idea to be taken seriously since chemists gave up on phlogiston. People act from the cerebral cortex at least as often as they act from the neocortex. This gives us wars and the herding instinct, makes bubbles and Ponzi schemes so exciting, and enables all sorts of wildly irrational behavior, like voting for Republicans or believing in Ricardian equivalence.

Hale "Bonddad" Stewart also weighs in a Noah's place, with a link to a post where he dismembers Ricardian equivalence with empirical data.  My kind of guy.

UpdateBrad Delong chides Noah, and in the process of clarification, confuses me further.

Friday, November 4, 2011

What the Hell Friday - Herman Cain Edition

I just heard Rachel and Eugene Robinson discussing the extraordinary weirdness of the Herman Cain campaign - if it is indeed a campaign.  They were speaking of it as performance art.  I have to admit that never occurred to me, and now it reminds me a bit of Pat Paulson.

The even weirder thing about this video is that the crowd cheers - wildly and with reckless abandon - when Cain says," I am the Koch brothers brother from, another mother."   OK - it was at a function sponsored by the Koch brothers group Americans for Prosperity.

If this is parody, it's brilliant, maybe even genius.  If it's real, then Cain is an inestimable buffoon.

The weirdest thing of all is that I seriously have no idea which of these propositions comes closer to the truth.


Source.

Saturday, May 28, 2011

Moron More on Short Term Interest Rates

A few days ago I drew these tentative conclusions:

1) The Fed has very little power to influence interest rates.
2) An attempt to move counter to the market might have an incalculable distorting effect.

But now, due to phantom inflation fears and the influence of zombie ideas, there are serious desires to raise short term rates both here and in Europe.

This is what 10 year bonds rates are doing.  I've posted the long term trend before.  You can see an update here.  Since peaking on Feb 8, well within the long range channel, rates have dropped from 3.725% to 3.06%.   Meanwhile, TIPS spreads have fallen from 2.66% on April 11, to  2.275% today.  The clear message of the market is that inflation expectations are low, and falling.

If the Fed succeeds in raising the Federal Funds Rate, which has been stuck at 0.25% for over two years, it will flatten the yield curve.  What will this accomplish?  With nominal rates vanishingly low, and inflation low, but still positive, we're in uncharted policy waters.  I suppose it depends on how far they go.  

Would a change of 0.25% matter to anyone?  Maybe not. But if it does, it will be harmful.

A change of 1% almost certainly would.  But with real short rates negative (nominal rate minus inflation {low, but still > 0.25%}) business is still sluggish.  What would a real positive interest rate do?

Still - the Fed usually makes it's changes in increments, not whole percentage point jumps.  Even a half percent change would be huge in the current environment.

Any attempt to raise short rates at this time would be a serious market distortion, in the direction of stifling the economy.  With unemployment high, the recovery sluggish, and no real sign of inflation, this would be insanity.

That word often gets used hyperbolically, but I am deadly serious.  It is very difficult to imagine a policy decision (short of adopting the Ryan budget plan) that would be more destructive to the economy - and more obviously so - than raising interest rates at this time.

Yet that is what very serious people want to do.

We're screwed.
.

Friday, April 29, 2011

What the Hell?!? Friday, Part 2 - "Dude, Where's My Inflation?!?" Edition

Via Krugman we find this FRED graph, showing a decade of inflation on a log scale.

Oh, and by the way: the hyperinflation types are not claiming some future event — they’re claiming that it’s happening now, and if you go back, you’ll find them predicting hyperinflation by 2010.


What those of us who are reality-based find is that we had an actual deflationary event when everything collapsed in late 2008.  Since then, inflation has returned to such a wild and extravagant extent that is has established a new trend line, with a lower slope.

But what about all that government spending, and deficits, and stuff?

Yeah -- What about it?
.

Wednesday, March 23, 2011

Economics is Bunk

In this interview with the New Yorker, Eugene Fama laughs a lot and admits he doesn't know anything, while insisting that there is no credit crisis and that markets are efficient.   I could not make this up.

Yes. It is exactly how you would expect the market to work.

I can tell a story very easily in which the financial markets were a casualty of the recession, not a cause of it.

I wonder how many economists would argue that the world wasn’t made a much better place by the financial development that occurred from 1980 onwards. The expansion of worldwide wealth—in developed countries, in emerging countries—all of that was facilitated, in my view, to a large extent, by the development of international markets and the way they allow saving to flow to investments, in its most productive uses.

Holy shit!  All of them? Fama thinks the Great Stagnation was/is an improvement on the previous decades!?!.  Even Scott Sumner wouldn't go that far.  (I hope.)  "Most productive uses" is particularly stunning when what we have seen is the misallocation of resources an an absolutely astounding scale.

Krugman wants to be the czar of the world. There are no economists that he likes. (Laughs)

NY:So you still think that the market is highly efficient at the overall level too?
Fama: Yes. And if it isn’t, it’s going to be impossible to tell.

WTF?!?   That sure makes your pet theory safe.

(Laughs) My attitude is this: if you are getting attacked by Krugman, you must be doing something right.

There really could not be a better concluding sentence to this interview.

Update:  I just read the comments following the interview.  19 of 20 think Fama has his head up his ass.
.

Sunday, February 6, 2011

A Different Look at Social Security

All the talk you might hear about Social Security financial problems and federal budget busting is lies and drivel - aka, BULL SHIT.  Let's have a look at SS funding for a different reason.

Here is some detail on the SS premium withheld from pay, from Money Zine.

Generally, FICA taxes are collected at a rate of 7.65% on gross earnings - earnings before any deductions. The breakdown of FICA is 6.2% for Social Security (Old-Age, Survivors, and Disability Insurance or OASDI) and 1.45% for Medicare.  The following table shows the FICA limits for 2005 through 2011:

2011 FICA Tax and Social Security Limits

  • FICA Tax Rate = 7.65% (see note below)
  • Social Security Limit = $106,800 
  • Maximum Social Security Contribution = $6,621.60 (employer) / $4485.60 (employee)
Note:  In 2011, the FICA tax rate for employees was lowered to 5.65%.  The employer tax rate remained unchanged, while the Social Security rate for employees was lowered to 4.20%.

2010 FICA Tax and Social Security Limits

  • FICA Tax Rate = 7.65%
  • Social Security Limit = $106,800
  • Maximum Social Security Contribution = $6,621.60

2009 FICA Tax and Social Security Limits

  • FICA Tax Rate = 7.65%
  • Social Security Limit = $106,800
  • Maximum Social Security Contribution = $6,621.60

2008 FICA Tax and Social Security Limits

  • FICA Tax Rate = 7.65%
  • Social Security Limit = $102,000
  • Maximum Social Security Contribution = $6,324.00

2007 FICA Tax and Social Security Limits

  • * FICA Tax Rate = 7.65%
  • Social Security Limit = $97,500
  • Maximum Social Security Contribution = $6,045.00

2006 FICA Tax and Social Security Limits

  • FICA Tax Rate = 7.65%
  • Social Security Earnings Limit = $94,200
  • Maximum Social Security Contribution = $5,840.40

2005 FICA Tax and Social Security Limits

  • FICA Tax Rate = 7.65%
  • Social Security Earnings Limit = $90,000
  • Maximum Social Security Contribution = $5,580.00

 At first, I wasn't going to pull such a long quote, but the information illustrates how the funding base increased through 2009, leveled, and now has been cut.  Many economists are enthused by the extra $2146 this will put into the pocket of whoever is making $106,800, and up - proportionally less for those who make less.  Again, I call BULL SHIT!  This will cause underfunding of the SS trust, and give ammo to those who claim SS is unsound and want to blow it up.  Big, big mistake.  It would have been far, far better to increase the dole in some other way for those at the low economic end of the spectrum.  But that is not anybody's goal these days.


Here is a look at total FICA collections per year from 1957 on.  The hook at the end is rather disturbing.  (Vide supra.)  Other than that, it's an exponential looking line, and those are hard for the human eye and brain to suss - at least for this aging, bifocal-laden human.  Let's try a log scale.


I'll over-state the obvious again, since it's central to my main point: a log scale presents a steady rate of growth as a straight line.  What we have here is clearly two different realms, with two different growth rates.  Each realm has a best-fit straight line superimposed.  Raising the amount collected per earner in the most recent years has not even maintained the slower growth rate of recent decades.  I picked a break point of 1984.  Your eyes might wiggle it around a bit differently, but that is a second order detail, at best.


Here is a close-up of recent history.


It's no surprise that the Clinton era was above trend, and the W regime pretty much defines the trend since Reagan.  Receipts for '08-9 are not just below trend, but flat, due to the recession.  In 2010 we have only actual decline in the data set.

What does this tell you about the state of the American worker?  Remember, the collection base went up every year through '09.

Here's a look at what a program in trouble - and then not -  looks like.  The plot is log of Total Fund Assets at the end of the year.


It looks as if the fund - for whatever reason - was not on a sound actuarial basis through the 60's and 70's - despite robust growth in collections.  During the Reagan administration, this was addressed, and the fund has grown every year since - even through 2010, with receipts stagnating.

Slower year over year growth in receipts since 1984 saved the program.  It will take someone with more knowledge than I have to explain that conundrum.

But my main point is that - at least through 2010 - total FICA receipts are an indirect indication of how the American worker is faring.  It's clear that since around 1984, he hasn't been faring very well.

Data through '09.
Data for '10.
  .

Saturday, January 29, 2011

Friday, January 28, 2011

What the Hell?!? Friday -- Vocabulary Expropriation Edition

Loyal readers will recognize the expression "Great Stagnation," which I coined all on my own, and have been using for quite some time to describe what economists routinely call the "Great Moderation."  

I don't read Tyler Cowan - though I recognize his name from being mentioned frequently at MB.  Cowan, professor of economics at George Mason University is a Hayek-style libertarian, free-market ideologue.  I have absolutely no reason to believe Cowan reads me, and would be astounded if he has any awareness of me at all.

But Cowan has now released an e-book (or, at 15,000 words, perhaps an e-pamphlet) titled - of all things - THE GREAT STAGNATION - How America Ate All The Low-Hanging Fruit of Modern History, Got Sick, and Will (Eventually) Feel Better.

The subtitle offers a broad hint about how Cowan's view differs from mine - primarily about causes, and secondarily about expectations, I don't see how we can ever get better without another New Deal. 

We have greatly different - probably even starkly incompatible - world views, but the same conclusion about the current state, though for totally different reasons.

What the Hell?!?   I want my pejorative terminology back!
.

Thursday, December 30, 2010

The Best Economic Blogs

According to Alen Mattich at the Wall Street Journal.  (With a H/T to James Hamilton.)

Alen is evidently a very serious person, since he placed Marginal Revolution at the top of the list, and Megan McCardle, who "is excellent" (gag) near the bottom.  No, I will not link to her.  I really don't feel like hugging a squid tonight.

You can certainly see why MR made it to the coveted apex.  Who but Tyler Cowan could read this story, and see in it a lesson about monopsony?

There are actually a number of good choices on his list - as evidenced by the fact that I link to them in my right-hand panel.

It includes - almost as afterthoughts - Delong and even Krugman, "albeit with the caveat that his ad hominem attacks detract from his analysis."  WTH?!?  I guess that is a reminder, lest we forget, that we're dealing with Rupert's Wall Street Urinal, so the connection with reality is going to be erratic. 

There are blogs listed that I've never checked out, so there is some future fodder, mayhaps.  But I'm genuinely baffled that he missed Modeled Behavior.  That site is mostly interesting and thoughtful, often erudite, and always promotes a staunchly free-market, libertarian-leaning conservative viewpoint.   And Karl, at least, will sometimes engage me.

Then again, Mattich thinks Megan McCardle, who, with her "bachelor's degree in English literature from the University of Pennsylvania, and an MBA from the University of Chicago" is no more an economist than I am,  is an "excellent" economic blogger.

If I were to say that explains a lot, would I be making an ad hominem attack that detracts from my analysis?
.

Friday, December 24, 2010

What The Hell?!? Friday - "Jesus was a NeoCon" Edition

I wasn't planning to put up a WHAT the HELL?!? post on Christmas eve, but, quite by accident the other night, I ran across these two seemingly contradictory posts, within about an hour of each other.

Jesus was a Jewish Communist.  This post is rich in biblical citations.  Here is an example.

Luke 6:24 : "But woe to you who are rich, for you have already received your comfort."

Jesus was the Perfect Conservative.  This post, alas, is bereft of biblical citations, so we must take the allegations on -- uh . . . faith.

These two ideas seem irreconcilable.  But I found both on the inter-tubes, so - Hey! - They have to be true.  But - now what?

Maybe there is just a bit of temporal dislocation here.  Consider that the original Neocons, like Irving Krystol, were Jewish Communists (specifically Trotskyites) who, with the passage of time, and through some sleight-of-mind that is beyond my comprehension, became Goldwater and then Reagan conservatives.  I guess this validates Russell Kirk's point that conservatism is a mindset, and not an ideology.  But more importantly, what is the passage of time to God - a mere trifle, I'm sure!

Now, I realize it's hard to imagine Jesus wanting to, frex, "bomb Viet Nam back into the stone age."  Or Pakistan either, for that matter.  On the other hand, though, those people are MUSLIMS . . .

I'm still having a hard time wrapping my head around this - but the world is a complex, messy place, and Einstein - who probably understood Jewish things better than I do - convinced me that there are things in it that I'm just not going to get.

But the only people I can think of who were both Jewish Comminists AND conservatives were the original Neocons.  Ergo:  Jesus was a NeoCon.  Q.E.D.  (Sort of)

I imagine there are those among you who are viewing all this with doubt and skepticism.  If you are so reality-bound that you aren't willing to set all that aside, then you are not ready to be a NeoCon.  Nor an Austrian economist.

Amen, amen, I say unto you - oh ye of little faith.
.

Saturday, December 18, 2010

They're Banning Kids in Florida for Wearing Red and Green!*

If you hear it on Fox, there's a good bet it's faux!

The Colbert ReportMon - Thurs 11:30pm / 10:30c
Blitzkrieg on Grinchitude - Gretchen Carlson & Christian Nation CHRIST-mas Tree<a>
www.colbertnation.com
Colbert Report Full EpisodesPolitical Humor & Satire Blog</a>March to Keep Fear Alive


* To understand the real horror and repression of the godless liberal fascist war on Christmas, you must sing the title of this post to this song:


H/T to Beale, who is in a really bad mood.
.

Saturday, December 11, 2010

Effective Tax Rates

With all the brouhaha over the expiration - or not - of the Bush tax cuts, it will be helpful to look at the actual effects of tax policy changes.  Tables of effective tax rates from the Tax Policy Center only go back to 1979, so this view is from the Reagan administration forward.   The TPC breaks it out a number of ways including income tax and FICA (which they call social insurance tax) by quintile, and with finer cuts for the top 10, 5, and 1 percent.    The also have a table for Total Federal Effective Tax Rate, which includes attributions of corporate taxes and federal excise tax, as follows. 


Corporate income taxes are attributed to households according to their share of capital income. Federal excise taxes are attributed to them according to their consumption of the taxed good or service.                                             

To my way of thinking, this gyration makes no sense.  In my estimation, they are attempting to make the tax code look more progressive than it actually is.  Total federal taxation actually paid by PEOPLE is the sum of federal income tax and FICA (Social Security + Medicare.)

Here is a look at the reality of tax policy changes.  The first graph shows the effective average rate by income quintile.  The blue box highlights the Clinton administration.  Clinton effectively adjusted the tax burden upward by relieving the lowest two quintiles at the expense of the top quintile.  This is the essence of progressive taxation.  Note also, the negative taxation on the lower two quintiles - the net effect of transfer programs.


Here is a finer break down of the top quintile.


Though the effective rates for lower quintiles were flat or down during the Clinton administration, the average for all quintiles crept up, because the top quintile - in all of its divisions - paid more.  Here's my narrative:  Clinton changed the top marginal rate from 32 to 39%, and the threshold for the top bracket from under $100,000 to $250,000.  This pretty much eliminated bracket creep for the middle class, and put it at the top, where it belongs.  The net effect was a big tax reduction for the bottom two quintiles, little net change for quintiles 3 and 4, and a tax boost for the wealthiest.  The result was improved GDP growth - four straight years at over 4% - reduced poverty and a balanced budget - rather sweet, wouldn't you say?

In conversations about tax policy, the FICA portion - known as the payroll tax - is often overlooked.  Let's not do that.


There are wheels within wheels here, so let's do some dissection.   From the beginning of the period, through 1990, there were annual increases in either the percentage paid in or the ceiling on which payments were based.  Frequently, they both went up.  You can see this effect most clearly in the bottom four quintiles, who always paid proportionally more, as a progressively larger chunk of their earnings was subject to withholding.  Also, the effect on the top tiers was minimal, as most of their earnings was above the ceiling.

During the Clinton years, the burden on quintiles 3 and 4 was close to level. Quintile 2 saw an increase as the rate was constant while the ceiling continued to creep up (ceiling eliminated for the medicare portion in 1993.)  For upper income earners the effective rate dropped, as greater portions of their income were above the ceiling.  Note that this was minimal for the upper 1%.  Such a huge proportion of their earnings is above the ceiling that rate and level changes are insignificant to them.

The odd looking line is the red one, for the effective rate of the lowest quintile.  That continues to increase until the millennium, before leveling off.  How can we explain this?  Here is my guess:  During the 90's, hundreds of thousands of jobs were added every month.  This allowed people in the lowest quintile to either find work, or find better work, so that they paid a constant rate on increasing wages.  This is also consistent with the slight dip and recovery that occurs in the early 2000's, with the recession of '01-'02 and jobless recovery, followed by the housing bubble.

Unfortunately, the data set ends with 2006.  I'm sure the story since then would be very interesting.

To wrap things up, let's have a look at total taxation - the sum of income and payroll (FICA) taxation, as it changed over time.


Only during the Clinton administration is there a spread in the top quintile, where the top 1% pays (a tiny bit) more than the 90th (or 80th) percentile.  To emphasize the political perspective, here it is by president.


Reagan - higher taxes for the lowest quintile; some wiggle, but not much change for the 2nd quintile; a step down, then close to flat for quintiles 2 and 3, a drop for the top quintile, until a jump up in 87.

Bush I - Poppy Bush had the misfortune of governing during a recession.  Growing deficits forced him to accept a tax increase, in a compromise with the Democratically controlled Congress.   But, he did shift some of the tax burden from the bottom 40% to the top 1%.  Did you read his lips?

Clinton - Increased taxes at the top, and reduced at the bottom.  For the rest of us, not much change.

Bush II - Lowered taxes for everyone - but - the biggest benefits, on a percentage basis, and even more so on a dollar basis, went to the top.

Letting the Bush II tax cuts expire will cost everyone something.  But the cost to lower quintiles is not much.

The right solution is to keep tax cuts for the lower and middle classes, let them expire for the top two quintiles, and forget the horrible idea of a social security defunding payroll tax holiday.

What do you think?
.

Tuesday, December 7, 2010

Some Thoughts on the Tax Compromise

First mine -

An unmitigated disaster.  Deficits will balloon even more, and the tax cuts will do nothing - NOTHING - to stimulate the economy.  If there is anything to the Laffer curve - and I think there might be - we are far, far to the low tax side of the peak.

Next, people who might actually know something.

No help for 99ers.  That sucks.

Southern Beale speaks for the left.

Krugman didn't like it going in.

I still think he's an optimist.

Update:  Here's James Kwak.

And Obama will no longer be able to say the tax cuts were a mistake made by President Bush that he was letting expire. Now he owns the mistake. This is a long way of saying that this isn’t a two-year tax cut to stimulate the economy (with a 0.29 multiplier, remember) in a recession. It’s a wedge of about 2 percent of GDP that is part of the structural deficit for the foreseeable future . . .

So finally, you have to ask, what does Barack Obama want? Does he really like most of the Bush tax cuts? Does he really think the bulk of the tax cuts are good for the country, and that going along with the tax cuts in the top brackets is a reasonable price to pay to keep them?
.
Update 2 (H/T to the LW):

Bernie Sanders is mad as hell, and he's not going to take it.

Update 3 (12/08):  Yes, this is "The Public Option Debate All Over Again."  Obama starts from an already compromised position, then gives in from there.


.