This is what it looked like, inflation in blue, GDP growth in purple.
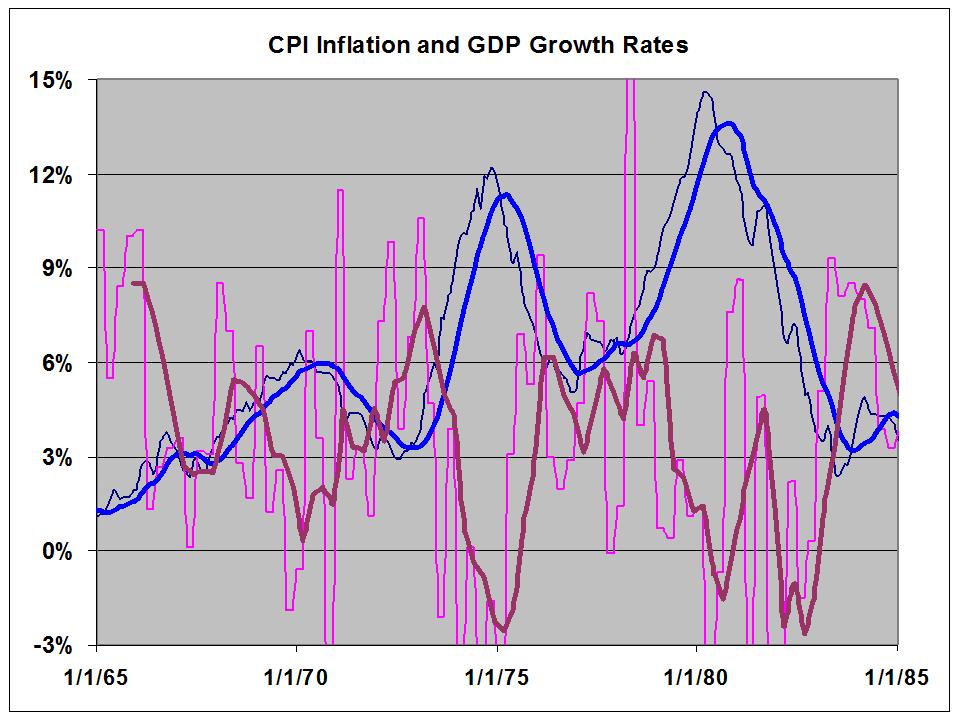
The lighter lines are the actual data, the heavier lines are annual averages. Note the striking contrary motion.
The point of this post is to emphasize how different now is from the 70's. Real growth over the last 8 years has averaged under 1.8%. CPI inflation has averaged 2.5%.
Getting the two data sets on a single graph is a real pain in the ass, so here they are separately.
Here is monthly CPI data, with a 12 month average in blue and an 8 year average in yellow.

Here is GDP growth over the same period, with a trend channel.

The two data sets are now displaying something close to similar motion - I believe this is what most economists - or at least the Keynesians - would expect.
Here is the contrast.
70's
High inflation.
Wild gyrations in Real GDP growth, with a moderate average.
Recessions led to sharp recoveries.
Strikingly contrary movement between the data sets.
This Millenium
Low inflation.
GDP growth not changing much, except for the Great Recession trough, and clearly trending down across the period.
Recessions led to tepid recoveries.
Generally similar movement between the data sets.
A criticism against Keynesianism is that it couldn't account for stagflation. Fair enough. Does classical economics? Does Austrian economics? Not only no, but these schools of thought were rendered obsolete 80 years ago, when they couldn't account for an aggregate shortfall in demand. What we have now is unlike the the 70's, in every respect I am aware of.
It is not unlike the 30's though.
This is not a situation where Kenesianism needs to offer anything new. This is a situation that Keynes understood very well, and the prescriptions that worked the first time around will work now as well.
There is no threat from stagflation. There is no threat from inflation. There is a real threat from deflation, which is now seeming inevitable, both here and in Europe.
But people everywhere are worried about inflation.
We are SO screwed.
![[Most Recent Quotes from www.kitco.com]](http://www.kitconet.com/charts/metals/gold/tny_au_xx_usoz_4.gif)


7 comments:
Hi, Jazz. Sometimes I wonder where you went, and then suddenly there you are, with a new post that makes mincemeat of something I said.
I love it.
"Getting the two data sets on a single graph is a real pain in the ass, so here they are separately."
Is the difficulty because the frequencies differ? Monthly (CPI) and Quarterly (GDP) ?
I have not worked that out yet, but it seems there has to be an easy work-around. I hope.
On stagflation since the '70s:
"What we have now is unlike the the 70's, in every respect I am aware of... There is no threat from stagflation. There is no threat from inflation. There is a real threat from deflation..."
Well yeah, now. Since the crisis the threat is deflation. But suppose we set the crisis aside as the inevitable consequence of bad policy, and just look at the period of bad policy. There was inflation all the while. It just wasn't in the news anymore, like radioactivity in Japan. But it was there all the while.
You write:
"Inflation during the 70's (1970 to 1980, inclusive) averaged a hefty 7.7%, while Real GDP growth averaged 3.2%... The point of this post is to emphasize how different now is from the 70's. Real growth over the last 8 years has averaged under 1.8%. CPI inflation has averaged 2.5%."
Reaganomics suppressed inflation, and low inflation suppressed growth, and things continued to get worse. Don't compare the recent numbers to the 1970s. Compare them to the goal of 3½% or 4% growth with price stability. We have sluggish growth, and we have inflation: We have stagflation. Reaganomics did not solve the problem.
Recall your definition: "Stagflation is an unusual economic condition characterized by low growth and high unemployment (stagnation) coupled with generally rising prices and wages (inflation.)"
We never solved the stagflation problem. We never eliminated the excessive debt that burdened the economy, creating costs that led to stagnation and solutions that embraced "inflation stability" rather than price stability.
Yes, the difficulty comes from the different frequencies. To get the 70's graph, I copied the quarterly data into the all 3 months of each quarter. Doing this for years of data is a real PITA!
We are bantering over semantics. For stagflation you have to have HIGH inflation, not the disinflation we have had for decades. The stagnation part is what has lingered - and gotten worse. The inflation has not, and for stagflation, you have to have both.
Further, they both must be troublesome. CPI inflation of 2.5% is not troublesome. In fact, it is too low. And even more so, since CPI overstates inflation in the current situation, where energy shocks are not affecting core inflation.
I do not believe Reaganomics suppressed inflation. Propose some mechanism where profligate spending, reduced taxation and record deficits are anti-inflationary. I'm pretty sure you can't make that case.
Inflation was in a bubble, and it burst.
By the way, the threat has been deflation for a decade. Everybody has forgotten 2002.
I'm comparing now to the 70's specifically to refute your clam that we have stagflation NOW.
I agree that we never solved the stagflation problem. It faded away on its own, when inflation started to drop.
Cheers!
JzB
"I'm comparing now to the 70's specifically to refute your clam that we have stagflation NOW."
Sorry about that. Not the first time I have generated confusion that way. It's in my NYRs.
"CPI inflation of 2.5% is not troublesome. In fact, it is too low."
Oh, that sounds so much like a call for inflation stability. I'm the last man standing, calling for price stability.
See Friedman here.
I think "the disinflation we have had for decades" corresponds to the declining GDP growth trends we have had for decades. The economy is shriveling up. Doesn't mean stagflation went away. Look at all the calls for more spending to increase growth: the objection is that it would cause inflation. Those guys are saying growth is okay. You are saying inflation is okay. I am saying the problem remains.
"Inflation was in a bubble, and it burst."
"I'm pretty sure you can't make that case."
Look at the peaks in your inflation curve. They correlate to two events: The 1973 Oil Embargo, and the 1979 Iran cut-off of oil exports in the aftermath of the Iranian Revolution. They are, in short, producer price inflation that rippled through the economy. Monetary inflation happened because, confronted with higher prices, people used consumer credit for the first time, thereby effectively increasing the money multiplier. Remember that the modern era of swiping plastic everywhere did not start until the mid 1970's, before then you paid cash for pretty much everything. The first time I ever saw a credit card transaction occur for gasoline was in the mid 1970's, and that was one of those deals where they stuck the card and a carbon copy ticket in a machine and hand-swiped it onto a carbon copy.
So could that happen today? Well, clearly we have commodity price inflation in the sense that oil keeps jumping around in price. But what we don't have is untapped reservoirs of consumer credit. Instead, we had a massive deflationary event -- the collapse of housing prices -- that, as with the 1929 stock market collapse and subsequent bank collapse, resulted in a sudden contraction of the money supply because it cut off the taps of consumer credit and required people to start paying down their loans instead. The result of commodity price inflation, then, in the face of a restricted money supply, is a reduction in demand, which in turn limits overall inflation because it means that eventually there will be a surplus of the commodity on the market due to reduced demand for the commodity.
In short, only by ignoring money supply inflation and deflation and the inflationary effects of consumer credit expansion can you say that there's any chance of stagflation under current conditions. Everything currently is pointing at monetary deflation with price stickiness. There will be hikes in prices of things with a fixed sunk overhead (e.g. things extracted from mines), but the only way I can see inflation happening would be if Ben Bernanke really DID do a helicopter drop of money -- e.g., by mailing a check for $50,000 to every single address in America. But he hasn't been doing that, instead he's been moving virtual money from one register to another within the walls of the Fed, without any economic activity actually being caused... meaning that what he's doing basically is just accounting tricks of no real import.
Tux -
Bravo! Excellent analysis.
My "energy shocks are not affecting core inflation" ink in the comment to art illustrates your point perfectly.
what he's doing basically is just accounting tricks of no real import.
And why QE II was a bust --no?
Cheers!
JzB
I second that emotion, Tux -- Your analysis is excellent. All the way through.
JzB, QEII wasn't a bust as such, it simply had modest goals, those goals being to stabilize various bond and security markets and help make bank balance sheets look better. It arguably achieve those modest goals. It didn't cause any economic activity, but that wasn't the intention, the intention was to prevent a freezeup of credit like happened in late 2008 and almost triggered a complete economic collapse if Bernanke had not done heroic things back then to allow the Fortune 500 to make payroll despite their money basically being frozen.
We argue that Bernanke needs to do more, that we actually do need some real inflation of around 4% per year in order to push money out from under mattresses back into the economy. But given current tax policies I'm not sure that would actually be a help. More on that when I'm more awake...
Post a Comment