Look: I am eager to learn stuff I don't know--which requires actively courting and posting smart disagreement.

But as you will understand, I don't like to post things that mischaracterize and are aimed to mislead.

-- Brad Delong

Copyright Notice

Everything that appears on this blog is the copyrighted property of somebody. Often, but not always, that somebody is me. For things that are not mine, I either have obtained permission, or claim fair use. Feel free to quote me, but attribute, please. My photos and poetry are dear to my heart, and may not be used without permission. Ditto, my other intellectual property, such as charts and graphs. I'm probably willing to share. Let's talk. Violators will be damned for all eternity to the circle of hell populated by Rosanne Barr, Mrs Miller [look her up], and trombonists who are unable play in tune. You cannot possibly imagine the agony. If you have a question, email me: jazzbumpa@gmail.com. I'll answer when I feel like it. Cheers!

Sunday, February 23, 2014

A Look at Debt and Inflation

Here's a scatter of the YoY change in CPI inflation vs the YoY Change in the debt of households and nonprofits.  [FRED Custom Chart]  If debt drives inflation, we should see an upward slope in Graph 1.
 

Graph 1 - CPI Change vs Debt Growth


Clearly, there is no upward slope - at least not any simple or easily discernible way.   To try to make some sense of this, I color coded the points for different time periods.  That is shown in Graph 2.

Graph 2 - CPI Change vs Debt Growth, Color Coded


Once the light blue points are segregated, it's pretty easy to see that the remaining points reside mostly in a horizontal band.

Here is the arrangement.

1952 -60     Yellow - Eisenhower
1961 -68     Dark Purple  - Kennedy-Johnson
1969 -71     Green - Preamble to the Great Inflation
1972 - 82    Light Blue - The Great Inflation
1983- 92     Dark Blue - Beginning of the Great Stagnation
1993 - 00    Red - The Clinton Stability
2001-08      Dark Blue - Culmination of the Great Stagnation
2009 on       Pink - The Great Recession to now

As it turns out, the Red and Dark Purple points are hard to differentiate.  [if you right click on the graph and select "Open link in new window," you can blow up the graph by clicking "Control" and the "+" sign several times.]  The red points are more closely clustered and surrounded by the purple. There are the hearts of your two little moderations.

Originally I had the entire 1983 - 08 period in dark blue, then decided to highlight the Clinton years in red to see if anything stood out.  What we find is a short period of the greatest stability in the record, regarding both of these two variables.

So, the data tells that for the post 1952 period, there is no robust relationship between debt growth and inflation.  In fact, except for the Great Inflation period, the relationship might even be slightly negative.  The 1969-71 period, just prior to the Great Inflation, has the unique combination of lower debt growth and higher inflation than any other time in the data set.

Also, the Great Recession and it's aftermath are unlike anything else we've seen in recent decades.

Bottom line, though, is that a rate of CPI inflation of 3 +/- 1% is associated with the entire range of debt growth in the modern era.  And, if debt growth is a serious factor in health of the economy, inflation targeting is close to meaningless as a policy tool.
 

Thursday, February 13, 2014

The Traffic Trap

Commenter OwenKL writes a bit of poetry most days to compliment the theme of the L.A. Times Crossword Puzzle.

Today's was a typically clever example

But I thought of a different Christie, and came up with this.

The Traffic Trap

Chris Christie writes cover-up scenes
Of denial re: that bridge west of Queens.
Why would it be
He put the screws to Fort Lee?
Just to vent his too partisan spleens!


Friday, February 7, 2014

Six Decades of U.S. Population Growth

2/08 Update - This is substantially revised, including more and better graphs.

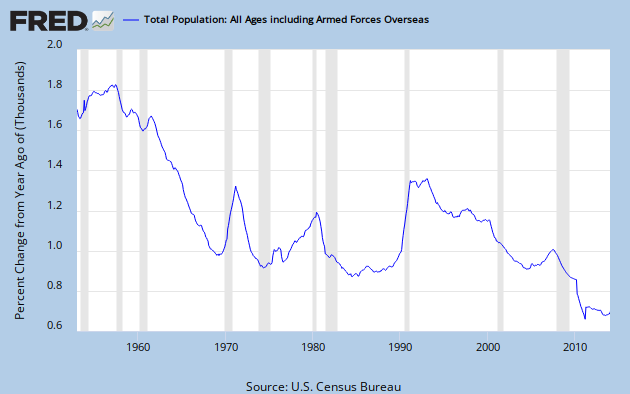
The growth rate of the U.S. population has been in a generally downward trend since the post-war baby boom peaked in 1957.  Graph 1 shows the YoY percent change in the total population.

Graph 1 - U.S Population Growth since 1952

The precipitous growth rate drop through the sixties came to an abrupt halt in 1969, when early boomers like me started having our families.  My son, daughter and two step sons were all born in the blip spanning 1969 to '73.  There might be a similar reason for the mid to late 70's growth rate, but there also might be a bit more to it.

Graph 2 shows the birth rate per 100 population since 1950.  [1980 - 2010 data from CDC.]


Graph 2 - Birth Rate per 100 Pop

The drop in population growth rate through the 60's is explained by this data. You can also see the mini-peak from 1969 -73, the initial wave of boomer offspring.   Then there is another peak at 1990.  But that doesn't do much to explain the simultaneous big jump in population growth.  We'll see what does, shortly.  Also note the drop after the slight maximum in 2007.

To avoid any chance of getting a mistaken impression, let's also look at the annual birth numbers, shown in Graph 3.

  Graph 3 - Number of Live Births

Without the per population denominator, the post 1980 portion of the graph looks quite different.  Now the 1990 peak seems a lot more significant, with the greatest number of births since 1968.  And the barely discernible blip in 2007 on Graph 2 is revealed as the greatest number of births ever, just slightly edging out the 1957 post war baby boom peak.  But the drop from 2007 to 2012 is meaningful.  The 2012 birth rate of 1.27/100 pop is a record low.  It corresponds to a total fertility rate of 1.93 births per woman over her lifetime.  The replacement rate to keep native-born population from declining is 2.1.

The other source of population growth is immigration.  And, as Graph 4 shows [data from Table 1 at this link.] it accounts for a big chunk of the population growth in the early 90's.

Graph 4 - Immigration from 1950 on

The peak runs from 1989-93, with the maximum value in 1991.  I've imposed an exponential base line by putting an Excel generated best fit curve through the highlighted data points. The raw number of annual immigrants has generally increased over time, and has mostly run well above the base line since 1989. But now it has been basically flat since 2007.  The above-trend numbers of the late 70's contributed to the increased population growth at that time.

Graph 5 shows that, in raw numbers, for recent years births outnumber immigrants by not quite 4 to 1.


Graph 5 - Ratio of Immigrants to Births

The final component to population change is the death rate.  This data was not as easy to locate, is less detailed, and there are some discrepancies among various sources.  I took data before 2000 from info please, and from 2000 on from indexmundi.  I don't put a lot of faith in the 2nd decimal point.   Graph 6 shows the data.

Graph 6 - Death Rate per 100 Pop

The big drop in mortality during the 70's and 80's isn't hard to understand.   There were big medical advances leading to increased disease survival and longer life expectancy. At the same time, there were huge improvements in automotive safety that saved thousands of lives every year. On-the-job safety might also have been a factor, since OSHA was formed in 1971.  The slight increase in the late 90's and sharp drop after 2000 are more mysterious, but that might just reflect the quality of the data.

My first thought was that before about 1980, births dominated population growth, and after about 1990 immigration took over.  During the early 90's, at least, immigration dominated.  That may still be true.  As the number of births has dropped sharply, the birth rate has fallen to an all time low since 2007.  Population growth has stabilized at an historical low level, and hasn't declined further in the last 3 years.

One thing that is clear is that without immigration, the U.S. population would go into decline as my generation passes on. 

Ralph Kiner Ends His Gig On Earth

Ralph Kiner entered the major leagues the year I was born, and had a 10 year career. I recognize his name, but have no recollection of him as a player. He led the NL in HR's the first 7 of those years, and was one of the truly great players of all time.

He went on to a much longer career in broadcasting, and is probably better known and loved for that phase of his life

He passed yesterday at the age of 91.

RIP Ralph.

You were one of a kind.

Update

Kiner dated both Liz Taylor and Janet Leigh.  Here is the story of when he met Leigh's daughter Jamie Lee Curtis.


Wednesday, February 5, 2014

Quote of the day

I once remarked to another anatomist that the courses of many of the nerves in the human body don’t suggest “omniscient, omnipotent supernatural being of pure perfection” so much as they do “amateur electrician and the Three Stooges rewire a house”.
                              -- Commenter wjts, at LGM

Saturday, February 1, 2014

Random Thought

I've decided I never want Chris Christie to be my bridge partner.

Real GDP per Capita

My last Angry Bear post generated such a wonderfully amusing comment stream that I couldn't resist posting a follow up.  One of the criticisms was that I didn't consider Real GDP per Capita.  At the risk of having anyone think I accept homework assignments from trolls, here is a look at that very thing.  I'm snowed in tonight, so what the hey.

I usually like more finely granulated data over a longer time span, but sadly discontinued FRED series USARGDPC gives us annual data from 1961 through 2011, and that's plenty good enough to make a point; the point being that the American economy is dying a slow and agonizing death.  This, alas, despite enormous tax cuts enduring over decades.  For the supply-siders among you, we'll take an extra special look at the Reagan years.

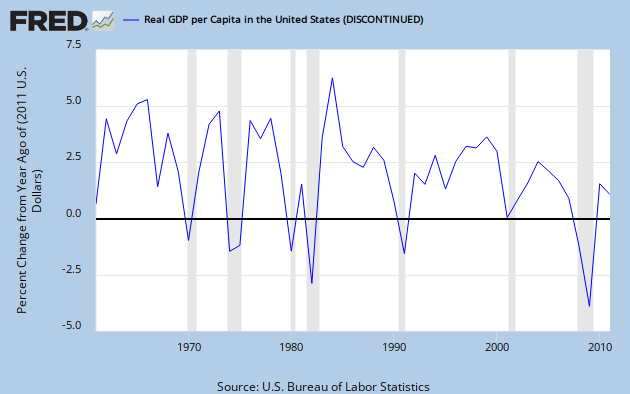
Graph 1, from FRED, shows YoY RDGP growth over the span of the data series.

Graph 1 - RGDP per Capita, YoY % Change

The single most prominent feature of this trace is the downward trend over time, characterized by both lower lows and lower highs.  This should be pretty obvious, even to the causal observer; but if you cannot see it, don't be disturbed, I'm going to help.

 Graph 2 shows the same data, along with some trend indicators.

Graph 2 - RGDP per Cap, % Change, with extra colored lines

Parallel trend channel boundaries are indicated in red and green, with the center line in yellow.  The Excel generated least squares trend line is in dark blue, and a moving 5 year average in purple.  Each of these additions is a visual aide, indicating that the trend over time has, indeed, been down.  Certainly, it has not been monotonic.  The real world seldom works that way.  But what you see here, with some exceptions, are mostly worsening recessions, and increasingly anemic recoveries.

Next, let's focus in on the 5 year average.  Graph 3 gives that to us, along with it's own set of trend lines.  The vertical axis is truncated relative to graph 2, and the downward slope is therefore emphasized.  This makes it easier to see that the 1990 peak is considerably lower than the double peak of '66 - '69.


Graph 3 - 5 Year Average of RGDP per Cap Change, with extra colored lines

The 5 year average is in purple.  The base data and least squares trend line are in grey, The red, green and yellow lines are again parallel channel boundaries and midline.  The last time the average line touched the top channel border was in 2000.  After that, despite the Bush tax cuts, things went into a bit of a decline, culminating in the worst financial disaster since the Great Depression.

I know what you're thinking.  The next to last peak in Graph 3 came in 1990, the culmination of the Reagan miracle, just before his buzzards came home to roost, costing Bush Sr. his chance at a second term.  But remember that that peak is considerably lower than those of the 60's, and scarcely above the mundane years of '70 to '73.

And back in graph 2, the highest single growth year ever was in 1984, the third year of phase-in for Reagan's 1981 tax cut.  Well, sure - but note that 1984 was a one-off, and also the recovery year from an exceptionally deep Fed-induced double-dip recession in the previous 3 years.  So, beside a lot of pent up demand, there were a few other things going on that might have given RGDP a boost.

Graph 3 shows the Effective Federal Funds Rate, which made an erratic drop from a high of just over 19% in mid '81 to 15% in early '82, then to under 9% by 1984. 

Graph 3 - Effective Fed Funds Rate, 1980 to '84

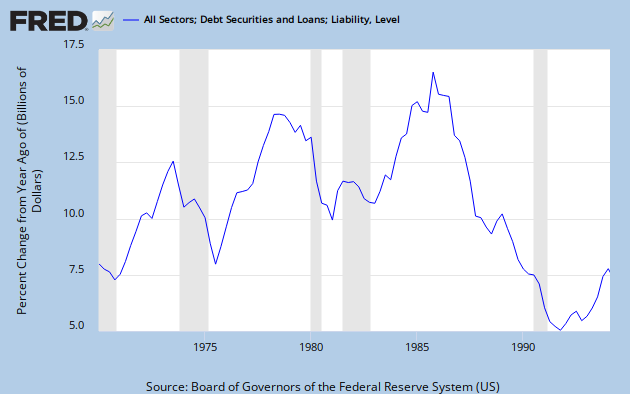
Graph 4 shows the explosion of credit that occurred coming out of 1982.  By 1984 it was close to an all time high.  It finally reached that peak in 1986, then collapsed.for the rest of the decade.

Graph 4 - Credit Expansion, 1978 to 1994

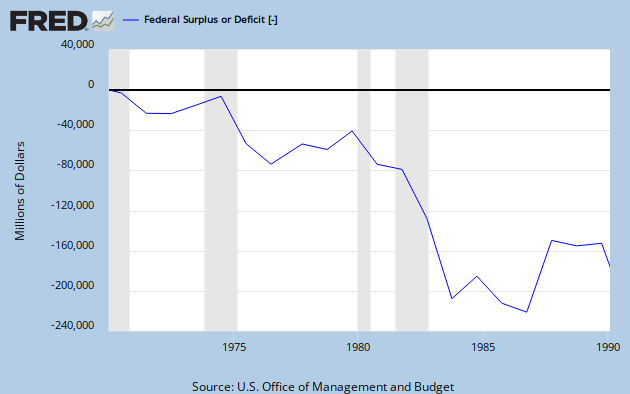
And let's not forget that Reagan was responsible for what was at that time, the most profligate explosion of federal spending ever seen, as shown in Graph 5.

 Graph 5 - Reagan's Deficit Spending

So let's recap.

Big picture: Decades of tax cuts have not led to increasing prosperity.  Quite the opposite.  The growth rate of RGDP per capita has declined substantially since the tax cuts of the 60's, and most severely since the 2001 tax cuts.  The ensuing change in RGDP/Cap growth is somewhat reminiscent of what happened from '69 to '75, but as yet without much recovery.

Focus on the Reagan years: After a long and deep recession, tax cuts plus the steepest decline in nominal  interest rates ever seen in the 20th century, plus a huge expansion in federal spending, plus an explosion in credit resulted in a single year of outstanding GDP growth, followed by four decent but less than stellar years, which incidentally also included the 1986 tax cut.  Then, alas, in 1991, there was another recession.

If you can look at this data and still have the opinion that tax cuts boost the economy, then knock yourself out.  Everyone is entitled to an opinion.  But you might want to ponder why your opinion has so little overlap with reality.

I welcome your comments, but please keep them more or less relevant to the topic, and if you are going to disagree, please bring more than assertions.  Facts and data have some gravitas.