Graph 1 RMHI - First View - 1982-4 $
Except for the bump during the housing bubble, it been a downward track for this century. During the alleged recovery from the great recession, median income has dropped badly.
From this post at EconoSpeak,I found out that Census Beareau Table H-06 has a greater data range, from 1975 to 2012, and also an RMHI calculation. So I plotted their data in Graph 2.
Graph 2 - RMHI - 2nd View - 2012 $
Instead of CPI, the Census Bureau uses CPI-U-RS, a research series based on constant 2012 dollars. So the numbers are different, but the picture is the same. I've added a trend channel, because I'm amused by that sort of thing. Presumably, the Great Recession [GR] ended in 2009, but that's the year that the RMHI value fell below the trend channel lower boundary - possibly forever. A channel violation that severe almost always indicates that the previous trend is well and truly dead. The new trend looks pretty dismal. Welcome to hard times. By my calculation, RMHI is down by over 8% since 2000.
As far back as the data goes, RMHI has taken a hit in every recession. In days past, RMHI would recover to a new high after the recession was over. There was no recovery after the 2001 recession until the bubble years of 2005-7. That ephemeral gain to a new lower high was completely wiped out by the GR in 2008. Since then, things have only gotten worse.
In the Econospeak post linked above, poster Econoclast suggests that the standard way of viewing the start and end of recessions is flawed. His alternative is to consider that a recession is occurring when and as long as RMHI is falling. He then presents this table.
Table 1 - Two Views of Recessions
If we consider recessions as he suggests, then the oxymoronic concept of the jobless recovery can be discarded - and good riddance.
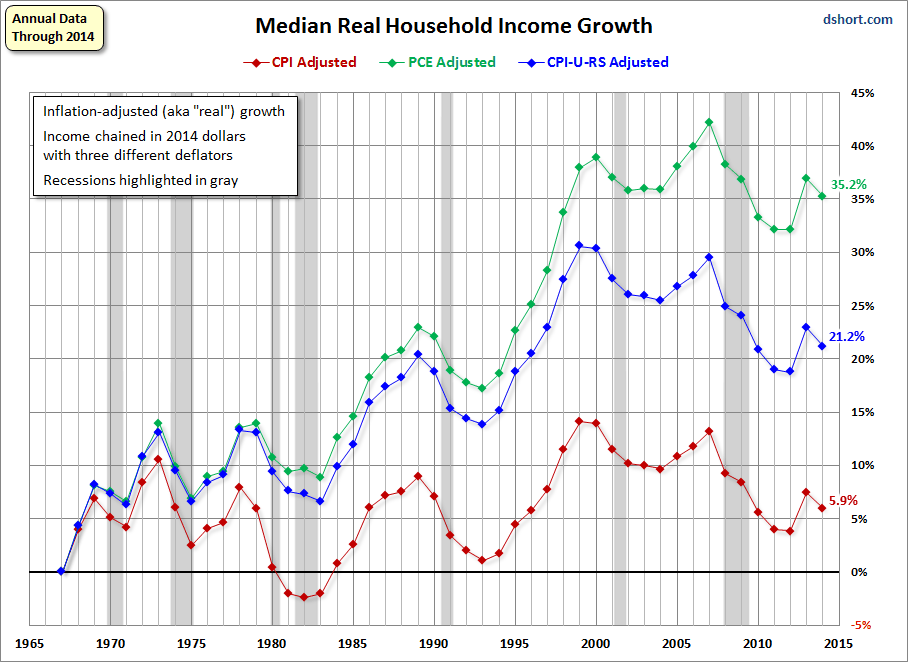
Via Mish, I found Doug Short's article on the Deflating American Dream. He presents longer view graphs based on data from Sentier Research, who estimate RMHI on a monthly basis. Short did a lot of homework, and was able to graph RMHI back to 1967. He also compared the two inflation series and found that CPI-U-RS understates inflation, relative to the CPI. The difference is miniscule in recent years back to the mid 90's, but expands quickly as you go back into earlier years. Graph 3 shows RMHI as adjusted by these two indexes, and also a third, PCE from BEA. There's a lot more in the linked post by Short and in this one, as well. Both are highly recommended.
Graph 3 - RMHI Growth - Three Views
The three curves don't disagree much on the timing of declines and advances, just on the magnitudes. By my count, using CPI as the adjustment index and Econoclast's idea of recession timing, we have been in recession for 21 of the previous 46 years, or 46% of the time.
There's your great moderation - I mean stagnation - in one simple, easy to understand picture.
Krugman points out that, "Adjusted for inflation, the income of the top 1 percent rose 31 percent from 2009 to 2012, but the real income of the bottom 40 percent actually fell 6 percent."
By my calculation, based on the data in Graph 2, RMHI fell by 4% from '09 to '12. So the folks below median got hit even harder. In the words of an old song, "There's nothing surer, The rich get richer and the poor get laid off!"
I've come to believe that greed really is the root of all evil.


![[Most Recent Quotes from www.kitco.com]](http://www.kitconet.com/charts/metals/gold/tny_au_xx_usoz_4.gif)


5 comments:
I've come to believe that greed really is the root of all evil.
I would suggest that the 2nd root of all evil is "agreed". Here's an example.
Should we make deep cuts in the food stamp program? Yes, I think we should. Okay then, it's agreed.
“Yes, the federal government has budget problems, but children didn’t cause them, and cutting anti-hunger investments is the wrong way to solve them,” said Bruce Lesley, president of First Focus Campaign for Children, a child advocacy group.
Sigh.
Greed and agreed.
I agree.
WASF!
JzB
As in the Eddie Vedder song, "It's a mystery to me we have a greed with which we have agreed."
golden goose sneakers
golden goose outlet
hermes online
christian louboutin outlet
giannis shoes
hermes
golden goose
adidas ultra
bape hoodie
christian louboutin outlet
b0l85k7u36 i3u44i3j89 g3x49u2m39 z1e97w4e95 o8d98b1d78 l6f69h4j61
Post a Comment