Observations:
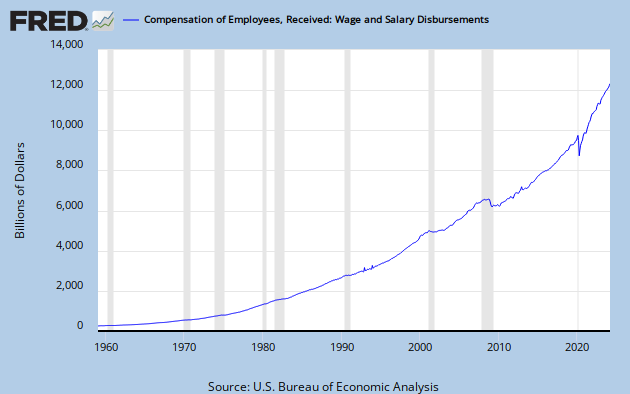
1) The same quasi-exponential curve shape one sees in lots of economic time series data. This is simply more-or-less regular growth. The interesting stories are in the irregularities.
2) Noticeable flat spots during recessions.
3) Effects of recessions seem to be getting greater with the passage of time: longer flats, lingering loss of slope; i.e. increasingly anemic recoveries, as measured by compensation.
4) The recent great recession has been particularly dire in its effects.
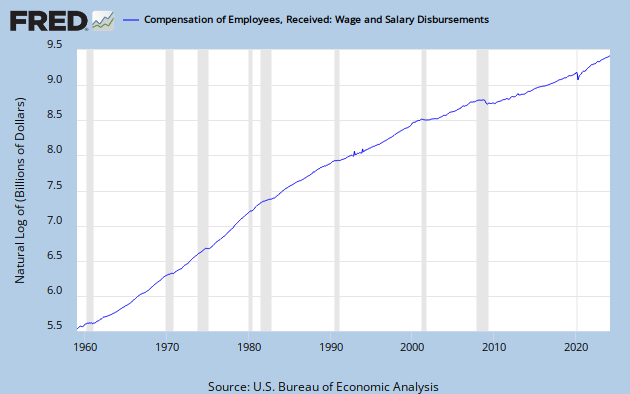
With this kind of data series, it's often helpful to look at it on a log scale. Remember, on a log scale, an upward sloping straight line indicates a constant rate of growth, with the steepness of the line determined by the growth rate.
Observations:
1) The line breaks in the early 80's, around 2000, and again in the Great Recession of 2008.
2) Each of these leads to slower growth in total worker compensation.
3) The current slope is extremely gentle, though that word feels distinctly oxymoronic in context. This is close to zero growth.
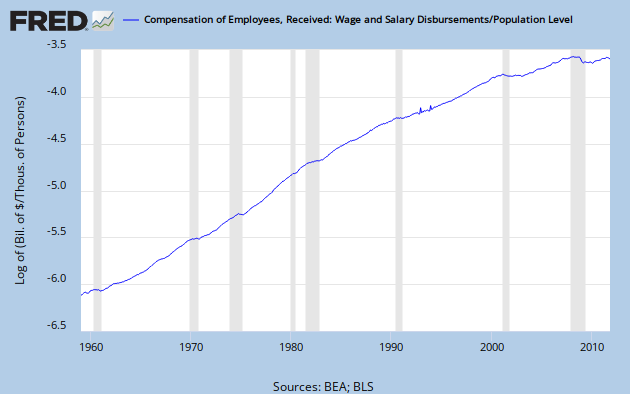
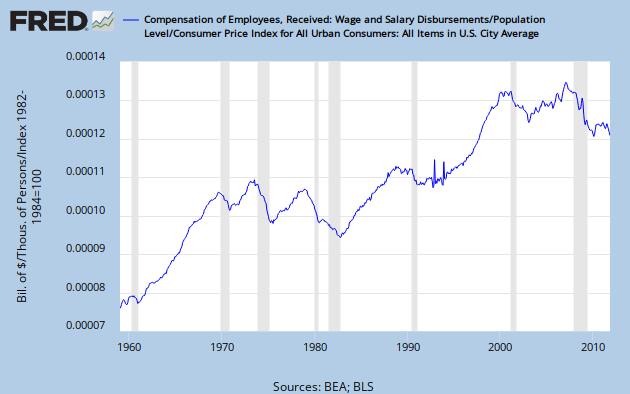
We're looking at total wage and salary outlays. FRED allows all sorts of data manipulations, so lets look at it per capita. For this I divided by FRED series CNP160V, Civilian Non-institutional Population. I also adjusted the time scale, starting at 1955 instead of 1950 to get rid of some wasted left side space.
Observation:
Adjusting for population growth doesn't change the shape of the curve in any substantial way, probably because population growth has been relatively constant over the period. Or, perhaps, there is something subtle that I am missing.
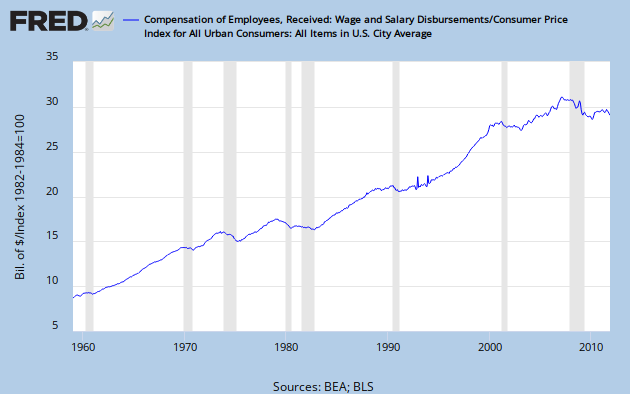
Here is how it looks adjusting for inflation, FRED series CPICAUSL.
Observations:
1) This is a lot more interesting: big loses in recessions, slow growth overall during the stagflationary 70's.
2) Anemic recovery from the Great Recession, actual flat line since.
3) Strong growth during the late 90's.
This makes me wonder how it looks per capita, inflation adjusted.
Observations:
1) Adjusting for both population growth and inflation is very revealing. Real Wages Per Capita (RWPC) churned through the 70's with the result being a net loss.
2) Recovery through the 80's barely brought RWPC to a new high.
3) RWPC plateaued, then slumped.
4) Robust growth through the 90's led to a meaningful new high.
5) Steep declines in both of this century's recessions.
6) Despite a marginal new high just before the Great Recession, the clear trend this century has been down.
Meanwhile, income and wealth disparity has reached historically high levels, and corporations are raking in record profits.
Remember, these numbers are total compensation, so they include whatever is being made by CEO's and rentiers in the finance sector. Don't forget about the differences between mean and median income.
Looks like we've been getting screwed for decades.
![[Most Recent Quotes from www.kitco.com]](http://www.kitconet.com/charts/metals/gold/tny_au_xx_usoz_4.gif)


4 comments:
Isn't it satisfying to "wander with FRED" ... to see what strikes you about a graph, and chase it down... Great post.
"these numbers are total compensation, so they include whatever is being made by CEO's and rentiers in the finance sector. "
But not cap gains, right?
Steve -
Since the series is titled Salary and wage disbursements, I have to assume that capital gains are not included.
Now I wonder about stock options and bonuses.
Cheers!
JzB
cheap jordans
balenciaga shoes
kate spade handbags
supreme t shirt
off white x jordan 1
golden goose outlet
air max
supreme clothing
jordan shoes
nike air max 2018
Post a Comment