- With the vehicle/1000 people number in the range of 825 to 845 since 2004, is the market near saturation?
- Is the January sales number of 14.2 SAAR (seasonally adjusted at annual rate) enough to maintain the vehicle/1000 people number?
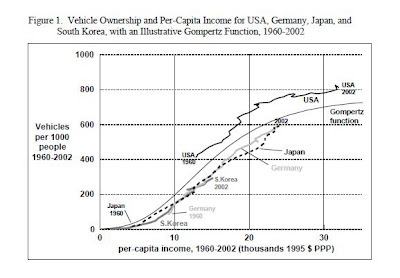
For the first question, I have to again credit Roger Chittum for pointing me to this 2007 paper, Vehicle Ownership and Income Growth, Worldwide: 1960-2030, by Dargay, Gately and Sommer (32 page pdf, data through 2002.) There's a lot to this paper, including projections into the future for vehicle sales and fuel consumption, worldwide. My immediate interest is in their use of a Gompertz function to estimate vehicle market saturation as a function of per-capita income.
Here is one of their graphs.
Graph 1 Vehicle/1000 Gompertz Function of Per-Capita Income
Their model indicates flattening above about $30K per year, and leads to a saturation point in the U.S. of about 852 vehicles per 1000 population. Saturation points for various countries also depend on urbanization and population density. See the paper for details and background.
This indicates that the U.S market is about 97% saturated, give or take a point.
What does that suggest for vehicle sales going forward? Karl Smith led off the month pointing to this graph from Calculated Risk, estimating light vehicle SAAR for February at 15.1 million. With that, on to question 2.
I already have the data in hand for vehicles/1000 population (see part 3.) The data for the Calculated Risk SAAR graph comes from BEA, Table 7.2.5S. Plotting a scattergram of YoY change in Vehicles/1000 population vs annual average SAAR for the years 1990 to 2009 gives us this picture. (See notes, below.)
Graph 2 SAAR and Change in Vehicles/1000 Population
This suggests that the break even point for vehicles per 1000 is right around 14.7 million annual average SAAR.
The official vehicle/1000 numbers are only available up to 2009. But we have the SAAR data for 2010 and 2011. Annual average SAAR for 2010 is 11.77; for 2011, it's 13.05. You probably don't want to take the values suggested by Graph 2 too literally, but seeing the vehicle/1000 number slip to around 815 for 2011 should be a reasonable expectation. This is still slightly above the 95% saturation level.
Average light vehicle SAAR for the first two months of this year is 14.65 - right at the break even point for vehicles/1000 population.
Notes on Graph 2
The red dots represent data for 2001 and 2002. The SAAR values look reasonable. The changes in vehicles per 1000/population do not. An increase of 25 in one year, from 800 to 825, followed by a decrease of 10 in the following year with SAAR, nearly identical (17.46 and 17.15) makes no sense. An average of the two, plotted for both years as yellow dots, by some odd coincidence, lies exactly on the best fit line.
The R^2 value of .43 is less than stellar, but not terrible.
Eliminating the two questionable points raises R^2 to a respectable .65.
Cross Posted at Angry Bear.


![[Most Recent Quotes from www.kitco.com]](http://www.kitconet.com/charts/metals/gold/tny_au_xx_usoz_4.gif)


4 comments:
red dots are cute little outliers in my book ;P
zongrik -
They look more like warts to me.
I guess that's why we say, "Your mileage may vary."
Cheers!
JzB
kyrie 9
yeezy 350
golden goose slide
curry 8
yeezy 350 v2
jordan 1 low
a bathing ape
hermes belts
golden goose sneakers
kyrie irving shoes
okjgr33fg8d2
golden goose outlet
golden goose outlet
golden goose outlet
golden goose outlet
golden goose outlet
golden goose outlet
supreme outlet
golden goose outlet
golden goose outlet
golden goose outlet
Post a Comment