This week, NVDA wildly exceeded revenue guidance, posting $13.5 Billion vs the expected $11 Billion, an increase of 101% over the same quarter last year. Impressive - no?
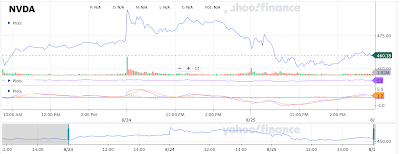
On Thursday, the stock hit a new intraday hi of 502.66 just after the opening, but then fell the rest of the day, losing 31 points and closing at 471.63, a fraction above the day's lo. [Graph 1, From Yahoo Finance.]
The most recent new closing high was 474.94 on 7/18, more than a month ago.
Here's a hard and unpleasant fact: even with this earnings blow out, the P/E ratio is 110.89. Will you scoff at me if I suggest that this is not sustainable? And the lack of a new closing high after this earnings report is not a good sign. Further, Friday's close was off 11.45 points, or 2.43%. I wonder - at this level, are there many buyers left?
Let's take a look from a longer view. Graph 2 shows daily closings from the middle of last year, along with trend lines and exponential moving averages. [Data source - Yahoo Finance]
Like just about everything else, NVDA dropped dramatically through the first 9 months of 2022. From the hi of 336.71 on 11/29/21 it slumped to a low of 112.27 on 10/14/22, a staggering loss of 66.36%. Then, at the end of the year, there was a higher lo, suggesting that the drop might be complete. This became an even stronger suggestion when the price crossed over the descending trend line [in violet] a few weeks later. From there it was up, up and away until the recent all time highs.
On 5/24/23 the stock rose 24.4% in a single day, and kept climbing for almost 2 more months. This leap carried the price far above the green up-slanting trend line, and this is what irrational exuberance looks like.
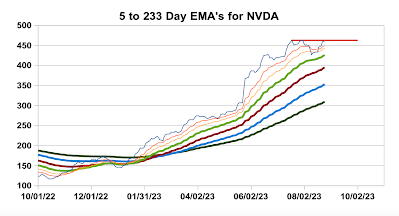
Graph 3 is a look at exponential moving averages of daily closings, from 5 day to 233 day periods.
The thin blue line is the 5 day EMA. It is more volatile and quicker moving than the longer EMAs. After its low of 116.83 on 10/14/22 the next intermediate low was 145.29 on 1/04/23. This also suggests that the bottom was in. This was confirmed by the cluster of long EMA lines in Early February. From Feb 1 to 21 the stock bounced around in the 210 to 220 range while all the EMA's continued rising.
All the long EMAs [55 to 233 day] continued rising right through 8/25/23, but the shorter ones have faltered. The 5 EMA line hit 462.9 on 7/19 then topped at 463 on 8/01, indicated on Graph 3 with the red horizontal line. It got close again on 8/24 and 8/25, but stalled under 462.
This looks to me like topping action. If 463 turns out to be a hard resistance line, then NVDA is going to falter. Right now it's hovering in tulip bulb territory, and a crash could be brutal.
If the P/E were to revert to a much more reasonable level of 30, for instance, the price would have to drop to about 125, for a loss of 73 percent from the 8/25 close of 460.18.
For comparison, Alphabet [GOOG] has a P/E of 27.57; Apple [APPL] is at 29.92; and Microsoft [MSFT] is at 32.46.
There's a lot of "if" here, and I don't have a crystal ball. The recent stall might be a pause to consolidate before the stock price doubles again. The market can stay irrational longer than most of us can stay solvent. NVDA ia a great company; but at these prices, I don't think it's a great stock.
EDIT
Here is an interesting insight, for what its worth.
Source:
https://twitter.com/JaguarAnalytics/status/1695109989663219925


![[Most Recent Quotes from www.kitco.com]](http://www.kitconet.com/charts/metals/gold/tny_au_xx_usoz_4.gif)


