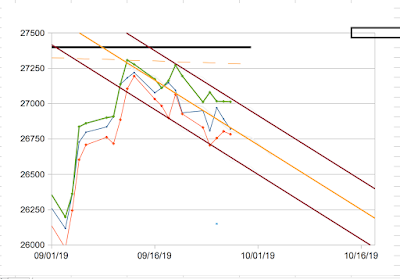
Here is a graph of the activity in the Dow Jones Industrial Index since the beginning of the month.
Dow Jone Industrial Average, Sept, 2-27, 2019
The black line at the top of the graph is a projection of the all time high of 27398.68, reached on July 16 of this year. The local high on 9/12 of 27306.73 didn't quite get there.
A couple weeks ago I drew a trend channel around the August decline, but that fell apart pretty quickly. Stock market analysis in real time is always dicey, and you can't fall in love with what you thought you saw.
Back at it, I've drawn a new declining trend channel, outlined in purple that looks like it began around 9/12. instead of just going by daily closings, this is now based on the intraday highs and lows. That's better and more complete information. Daily highs are in green, lows in red, and closings in blue. The midline of the channel is in yellow.
Note a couple of things. First, all the action this week is contained by the Tuesday high and low, 27079.68 and 26704.96, respectively. In Eliot wave terms, this suggests counter current action, and it's pretty week. I'm not very good at this, but I'm reading it as wave 4 of a five wave impulse decline that should play out in the next week or two. Wave 4 is unfolding and might take a few more days.
Wave 5 follows. Suppose wave 4 ends at 26900. Then a target range for the wave 5 bottom would be between 26330 and 26490.
Second, the center line of the trend channel has been a magnet for daily high, low and closing values. Since 9/12, several of these have wound up at or near that line.
This might seem like a cross between mumbo-jumpbo and science fiction. But I've been amazed by how many real world phenomena, and stock market action in particular, moves within channels.
I'll be very interested in seeing how this develops, and if my pessimism is validated.
For a big-picture view, see this post.
.

![[Most Recent Quotes from www.kitco.com]](http://www.kitconet.com/charts/metals/gold/tny_au_xx_usoz_4.gif)


1 comment:
golden goose sneakers
air max 270
yeezy boost 350
curry 6 shoes
nike huarache
christian louboutin outlet
chrome hearts online store
off white
air max 97
a bathing ape
Post a Comment