Part 2
First off, I want to thank Mark Sadowski for contributing, in a gadfly sort of way, to my thinking on this issue with his comments in Parts 1 and 2. So, this is not the part 3 post I had intended to write.
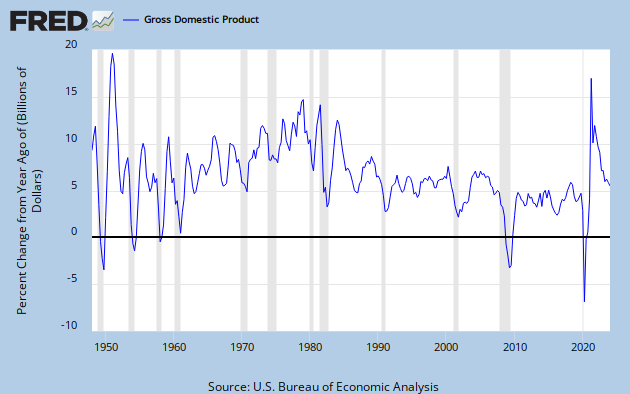
Mark suggested using a different transformation of the FRED NGDP series I've been looking at. Instead of taking YoY % change, he suggests using what FRED calls Compounded Annual Rate of Change [henceforth CARC.] Check the linked graphs and you'll see there's both more fine grain movement and swings to greater extremes in the CARC graph, and, as expected, the Standard Deviation values are higher. This is a different way of looking at the data. But is it a better way? I have no idea. If you have a convincing argument either way, let's see it in comments.
Graph 1 shows the 13 Qtr Std Dev of CARC. It's gross features are generally similar to the those of the graph of Std Dev of YoY Change. There's the steep fall bottoming in 1964, the rise into a broad double peak in 1981-3, followed by a steep drop to a bottom in 1987. Then we see the humps caused by the '91 and '01 recessions, and finally the sharp rise and fall due to the Great Recession. [In the YoY graph some of these extremes are displaced by about a year.]

Graph 1 - 13 Qtr Std Dev of CARC
The major difference between the two graphs occurs after the 1987 bottom. While the YoY Std Dev graph continues to slope down, the CARC Std Dev graph moves in a generally horizontal direction between the two red lines drawn from the Q4 '90 high of 2.95 and the Q3 '12 low of 1.17. Note however, that if the '91 recession had been worse or the '01 recession milder, we would still perceive a downward tendency to the peaks.
The two most recent Std Dev readings are 1.27 and 1.22, so the precipitous fall following the great recession has ended. Note that similar lows occurred in Q3 '98 and Q3 '99 at 1.29 and 1.25, respectively and Q3 '87 at 1.27. So - yes, we have recently observed the lowest Std Dev reading on record; but, no, it is not the lowest by any kind of great margin.
What accounts for the high Std Dev readings of the 70's and 80's - or, alternatively, what accounts for the low readings now? To explore this question, let's indulge in a couple counter-factual exercizes. But first, let's ponder what causes the Std Dev to be high, in general.
The main factors, in no particular order are
- The magnitude of the data values- frex, are they closer to 2 or to 22.
- The data spread envelope - frex, is it closer to +/- 10% or 110%.
- The data irregularity within the envelope - frex, does it gyrate wildly from extreme to extreme, or meander in a more leisurely fashion.
In the context of NGDP growth these factors become
- Average NGDP growth over a period of interest.
- The presence or absence of recessions.
- The growth variablilty in non-recessionary times.
Let's explore the recession factor first. As it turns out, there are two features that come into play here: the depth of the recession, and the nature of the recovery. The deeper the recession, the greater the change in growth from the preceding period. The snappier the recovery, the greater the change in growth from the recessionary trough. Both of these things turn out to be important factors. Note in the FRED Graph of CARC that the recessions of the 70's and 80's had sharp, short rebounds in which NGDP growth was unusually high for one or more quarters. So both the recession and the recovery contributed to high Std Dev values. Now note the recoveries from the last three recessions. Very little snap back from '91-92, only a little from '01-02, and none at all from the Great Recession.
Here's where our first counterfactual comes in. Suppose that the steep double dip recession of 1980-82 had never happened, or that it had occurred, but with only gradual recoveries from the troughs. These possibilities are illustrated in Graph 2.

Graph 2 - CARC with Counterfactuals

Graph 3 - Std Dev of CARC with Counterfactuals
Note also the sharp jump in Std Dev at Q2 '78, and the following plateau. This is entirely due to a single quarter of ridiculously high NGDP growth during the moribund Carter administration, and illustrates how a single anomalous data point can distort the Std Dev calculation for an extended period. The plateau ends at Q3 '81 when this point falls out of the 13 Q data kernel.
In comments to Part 1, Mark Sadowski asked if lower volatility isn't a good thing. My answer is -- only maybe. If it's caused by avoiding recessions, then yes. But if it's caused by lopping off the potential tops of recoveries, such as what we have experience these last three years, then no - not at all.
Here's another counterfactual to ponder. What would the Std Dev of CARC have been in the period we just looked at if NGDP growth were at the current level, but the relative volatility had remained the same? From Q2 '78 through Q3 '84, CARC averaged 9.93%. Suppose a counterfactual of 4.01% average CARC, which is what we have experience from Q3 '09 through Q1 '13, the recovery from the great recession. This is illustrated in Graph 4.

Graph 4 - Early 80's Counterfactual
The dark blue line is the actual CARC data. The horizontal blue line is the period average of 9.93. The brown line is the counterfactual CARC data, constructed by having each point be above or below the average of 4.01 [brown horizontal line] by the same percentage as the corresponding real data point. The light blue and red lines show the 13 Q Std Dev values for the two data sets, respectively. The Std Dev value for the entire real data set is 5.92. The Std Dev for the counterfactual data set is 2.39. This is again a reduction of just about 60%.
So, if you take the early 80's data and eliminate the recessions, Std Dev for the flatish period from Q3 '81 to Q1 '84 drops by 58% from 6.34 to 2.65.
Also, if you consider the volatility level of Q2 '78 to Q4 '84 along with the CARC level following the Great Recession, the Std Dev drops by 59.7% from 5.92 to 2.39. So this gives me another answer to Mark's question: If the low Std Dev is an artifact of low NGDP growth, then no, it's not a good thing at all.
These examples suggest that both the occurrence of recessions and the high level of NGDP growth just before the start of the alleged great moderation were about equally as important in contributing to the high Std Dev of that era.
So I have to modify my idea about the relative importance of these two factors in making Std Dev high or low. A low NGDP growth rate is only AS important, not MORE important than avoiding recessions
Remember, the point of this exercise is to show that the low volatility of current NGDP growth is neither remarkable, nor necessarily a particularly good thing. I think I'm getting there.
Next, In Part 4, I'll look at what I originally intended to look at in Part 3. Stay tuned.
![[Most Recent Quotes from www.kitco.com]](http://www.kitconet.com/charts/metals/gold/tny_au_xx_usoz_4.gif)


4 comments:
CARC? Eff it. GDP is an annual measure. Looks like the CARC figures the CAGR of the past four quarters, something like that. But GDP is an annual measure.
If you take CAGR for the whole period, volatility goes to zero. But that is certainly not remarkable.
CARC certainly exaggerates the changes.
BLUE: Percent Change from Year Ago, GDP, frequency Annual
RED: Percent Change from Year Ago, GDP, frequency Quarterly
GREEN: Compounded Annual Rate of Change, GDP, frequency Quarterly
http://research.stlouisfed.org/fred2/graph/?g=jL0
Art -
GDP is reported quarterly, and Recessions are determined to start and end in specific months, so I don't see a problem using quarterly data.
Your red line looks like a smoothed version of the green line, and the blue line like a smoothed version of the red line, which all makes sense I guess.
If you take CAGR for the whole period, volatility goes to zero.
Could you elaborate? I'm not following. Thnx
Cheers!
JzB
(Yeah, I use quarterly data too.)
If I have it right, you can take any start- and end-period and figure a constant rate of growth that gets you from start to finish.
At a constant rate of growth, I'm assuming the volatility would be zero.
I was suggesting that CARC may be quirky: excessively volatile at short periods and excessively unvolatile at long periods.
I didn't find good Google results for compound annual rate of change. So I was poking it with a stick.
Post a Comment