You can see the long range view of nominal and inflation adjusted GPD growth in Graph 1 of FRED quarterly YoY percent change data.
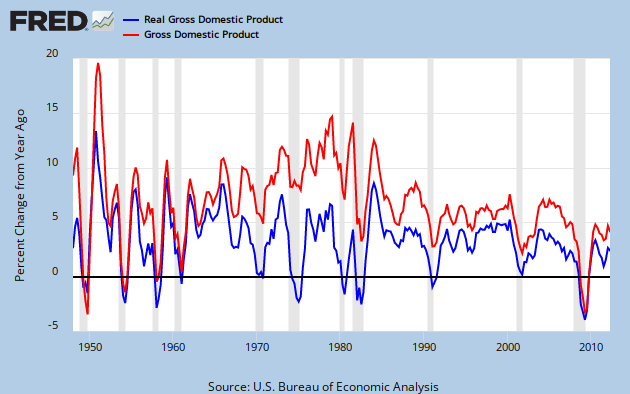
Graph 1 YoY growth Nominal and Inflation Adjusted GDP
Nominal GDP Growth was in a secular up-trend from 1960 through 1980. However, inflation adjusted GDP growth quickly peaked after the Kennedy-Johnson tax cut, reaching a maximum value of 8.5% in Q4 of '65 and Q1 of '66. It then dropped dramatically for the next four years. This peak value has been matched only once since: in 1984, during a sharp rebound from the double dip recession of 1980-82.
Since then, in the wake of numerous tax cuts, the rate of GDP growth has been anemic. To get a look at the rate of growth, I took an 8 year average of the annual percent change data presented above, and then plotted a 5 year rate of change for that data. This is essentially the 2nd derivative of GDP, or GDP acceleration, as shown in Graph 2.

Graph 2 GDP Acceleration
Inflation Adjusted GDP acceleration peaked in Q3, 1966. Fueled by the inflation of the 70's, NGDP acceleration stayed high until Q1, 1980, then plummeted for 9 years. It has been relentlessly negative since.
Inflation adjusted GDP acceleration has not done quite as badly in this disinflationary era, but has been below zero more than half the time since 1970. This is a little bit worse than coasting.
This all might seem a bit abstract, but the message is clear. If tax cuts were good for the economy, then GDP growth would be increasing. In other words, acceleration would be positive and most especially so after a tax cut. The data is not consistent with this notion.
Clinton's famous tax increase preceded increased GDP growth by either measure, and an upturn in acceleration. The Bush tax cuts preceded decreasing GDP growth.
I'm not going to get into a correlation vs causation discussion. I'll simply say that tax cuts over 5+ decades have been an utter failure at stimulating real economic growth in any inflationary environment. Since the real world data correlation is counter to the received conservative wisdom, it might be worth trying an anti-conservative approach.
It might also give the NGDP targeting enthusiasts something to ponder.
Cross posted at Angry Bear.
![[Most Recent Quotes from www.kitco.com]](http://www.kitconet.com/charts/metals/gold/tny_au_xx_usoz_4.gif)


6 comments:
From the conclusion of a Congressional Research Service report that agrees with you:
"The results of the analysis suggest that changes over the past 65 years in the top marginal tax rate and the top capital gains tax rate do not appear correlated with economic growth. The reduction in the top tax rates appears to be uncorrelated with saving, investment, and productivity growth. The top tax rates appear to have little or no relation to the size of the economic pie.
"However, the top tax rate reductions appear to be associated with the increasing concentration of income at the top of the income distribution."
http://graphics8.nytimes.com/news/business/0915taxesandeconomy.pdf
Good one, Roger. Not that we didn't know that already, but at least we have another data point to that effect.
You ignore your own graph. After 1985 it is positive for quite a while. Also, notice that, by taking a 5 year average, you introduce a lag time AND you perform a low pass operation, dampening the high frequencies, and by deriving twice, you perform 2 high pass operations, so you end up with a bandpass and frequency-dependant phase shifts.
Not sure what your signal says after all this messing around...
Dirk -
I'm assuming that by "it" you mean the blue line in graph 2 - the acceleration of inflation adjusted GDP.
Yes it is positive for a while, the second in a series of three peaks of increasing magnitude. This can as easily be explained by massive federal deficits as by tax cuts, per se. Certainly there are gyrations, but the real point is that the high values of the mid 60's were never matched again.
I'll admit that looking at GDP acceleration is a bit out of the ordinary, but think of it as an analog to vehicle acceleration. In the 60's, it was pedal to the metal. Through the 70's inflation gave a Turbo boost to NGDP. Since then it's been a repeating pattern of tapping the gas and then the breaks.
Unfortunately, we've been slowing down for all of this century.
In the abstract, taking an average introduces a time lag, but taking the derivative catches it up very quickly. Note the series of peaks in the red lines of graphs 1 and 2, from 1967-81. They line up almost perfectly.
Cheers!
JzB
air max 270
hermes handbags
yeezy 350
longchamp
jordans
hermes birkin
air jordan
golden goose
yeezy boost 350 v2
moncler outlet
jordan shoes
supreme clothing
moncler outlet
hermes handbags
supreme clothing
palm angels
supreme hoodie
off white hoodie
bape sta
kyrie 7
Post a Comment