Look: I am eager to learn stuff I don't know--which requires actively courting and posting smart disagreement.

But as you will understand, I don't like to post things that mischaracterize and are aimed to mislead.

-- Brad Delong

Copyright Notice

Everything that appears on this blog is the copyrighted property of somebody. Often, but not always, that somebody is me. For things that are not mine, I either have obtained permission, or claim fair use. Feel free to quote me, but attribute, please. My photos and poetry are dear to my heart, and may not be used without permission. Ditto, my other intellectual property, such as charts and graphs. I'm probably willing to share. Let's talk. Violators will be damned for all eternity to the circle of hell populated by Rosanne Barr, Mrs Miller [look her up], and trombonists who are unable play in tune. You cannot possibly imagine the agony. If you have a question, email me: jazzbumpa@gmail.com. I'll answer when I feel like it. Cheers!

Wednesday, February 29, 2012

Still More on Republicans

Three years and 10 days ago, I posted this on my old, obscure Tumbler blog.  Rereading it now, I find nothing to disagree with, other than my wistful self-identification as a conservative.  It explains why I have so much hostility toward the Republican party.

American history for well over a hundred years has been following a great arc of expanionistic imperialism - irrespective of who is in Congress or the White House.  The main drivers for imperialism are ego and the desire to take other people’s stuff: wealth, goods, trade routes, natural resources. The beneficiaries of American Imperialism have been corporations - formerly American, now International.  Repugnicants and Damorats are two branches of the same Corporatocracy.  The Repugnicants are worse, and the only thing the Damorats have going for them is that they are not Repugnicants.

Back in 1963 my father told me that every once in a while, if a crumb falls off the plate, the Dems might let you keep it.  The Reps won’t even do that.  At the time, I had no idea what he was talking about; but it stayed with me, and, by God, he was right.   I loath the Damorats, but dammit, they’re all we have.

More on Michigan Voting

The U.S. Election Atlas shows the Michigan county by county results for the general election in 2008.  Note that they have inexplicably reversed the normal Red-Blue color coding.   Contrast those results with the Republican primary results.

In the Lower Peninsula, the counties that went for Romney in a big way generally went for Obama in a much bigger way in 2008.  Wealthy, densely populated Oakland county went for Obama by 56% to 42% (660,000 total votes.)  Romney crushed Santorum there by 50% to 29%. (116,000 total votes.) Romney tended to win the counties that were close between Obama and McCain four years ago.   Along the west coast, though, many counties that were solidly in Obama's camp in 2008 went overwhelmingly for Santorum in the Republican primary.  But these counties had big margins on Tuesday with small turnouts.

UPDATE: Commenter CSH at Johnathon Bernstein's blog remarked, "I can't recall seeing the rich-poor, East-West gap in that state as strongly represented as last night."  CSH also pointed out that Romney won the State by 32,000 votes.  Coincidentally, he won Oakland County by 32,000 votes.  The rest of the State was a wash.

The Upper Peninsula as always, has its own different story.  Santorum carried all but two counties, and generally by large margins, while the the '08 vote was split among counties between Obama and McCain.  The primary was closest in the eastern section of the U.P., which McCain carried in '08.  But vote counts in the U.P. on Tuesday were very sparse - in the range of a few hundred to about 3,000 total, per county. 

It's far from one-to-one, but Romney's results vs Santorum more or less parallel Obama's results vs. McCain four years ago.  Romney's best showings were in places where he has virtually no chance in the general election.  Santorum's best showings were in less populated areas that are likely to vote Republican, regardless.

The other significant factor is voter turnout.  Romney and Santorum together collected 787,420 votes, Statewide.  In 2008, McCain got over 20 2  million votes in Michigan, and lost the State by 16%.

Despite the hype, the stark differences between the two front runners, and Romney's alleged home field advantage, the total turnout was less than half of McCain's votes in '08 this looks like a lot of less Republican apathy than I first thought, but still a significant lack of interest.  Can that bode well for their prospects in November?  (Corrections made in last 2 paragraphs.)


More On The Republicans

In comment responses both at Retirement Blues and at Angry Bear, I said this:

I'm not hoping for one party rule.  I'm hoping for a political process that has participants who believe in science, engage in honest debate, are genuinely interested in the well-being of he American people, and which focuses on issues of real importance to society.  
 
The Republicans fail each of these tests.  I would hope that a new party would emerge.
 
Over the last 40 years, the Republicans have abandoned conservatism and become regressive reactionaries with no valid political philosophy.   Their pandering to the religious right has dragged the discourse far off center. Political dialog for many years now has been between the right and the far right.  
 
If there is valid conservatism in U.S. politics today, it exists in the Democratic party.
 
In my dream, the new party arises from the left.  There is lots of room there. 

I guess my anti-Republican editorializing mislead people into thinking that I am some sort of  Democratic party partisan.  The reality is, I've been driven to the Democrats as the only existing alternative to the Republicans.  In fact, I've said many times, the only thing the Democrats have going for them is that they are NOT Republicans.

Even shallow-thinking pseudo-centrists like David Brooks are now catching on.  Brooks says:

 All across the nation, there are mainstream Republicans lamenting how the party has grown more and more insular, more and more rigid. This year, they have an excellent chance to defeat President Obama, yet the wingers have trashed the party’s reputation by swinging from one embarrassing and unelectable option to the next: Bachmann, Trump, Cain, Perry, Gingrich, Santorum.

 But where have these party leaders been over the past five years, when all the forces that distort the G.O.P. were metastasizing? Where were they during the rise of Sarah Palin and Glenn Beck? Where were they when Arizona passed its beyond-the-fringe immigration law? Where were they in the summer of 2011 when the House Republicans rejected even the possibility of budget compromise? They were lying low, hoping the unpleasantness would pass. 
 
.   .   .   

 Without real opposition, the wingers go from strength to strength. Under their influence, we’ve had a primary campaign that isn’t really an argument about issues. It’s a series of heresy trials in which each of the candidates accuse the others of tribal impurity. Two kinds of candidates emerge from this process: first, those who are forceful but outside the mainstream; second, those who started out mainstream but look weak and unprincipled because they have spent so much time genuflecting before those who despise them. 

 Brad Delong responds to Brooks (emphasis added):

As I have written in the past: You know, I went to Washington in 1993 to work for what we called Lloyd Bentsen's Treasury as part of the sane technocratic bipartisan center. And it took me only two months--two months!--to conclude that America's best hope for sane technocratic governance required the elimination of the Republican Party from our political system as rapidly as possible. Dole and Gingrich's "We really don't care that these policies are good for the country--are a lot like policies we would enthusiastically support if proposed by a Republican president--but we are going to try to block them because that will weaken Clinton" was a real eye-opener. Nothing since has led me to question or change that belief--only to strengthen it. We really need a very different opposition party to the Democrats: a less dishonorable one.

Now David Brooks--who has spent the last nineteen years carrying water and making excuses for today's Republican Party--finally says what I have been saying since 1993. Where have you been, David?

Here is the simple truth.  The Republican party leadership has no concern for the vast majority of the American people.  They are not patriotic in any conceivable meaning of the word.  They are motivated exclusively by greed and power, and are bent to the will of their overlords in the elite American financial aristocracy.   Republican politicians, ex Ron Paul, are of two types: those who are on board with that program, and tea-party nut jobs.

The Republican party, as now constructed, is a clear and present danger to everything we believe America is supposed to stand for.  Their ideas of freedom are directed at corporations, not people.  Their alleged free-market principles are welfare for the rich and a finger in the eye to everyone else.

Unfortunately, the Democratic party leadership is bent in the same direction - thus has it ever been with money and power.  But there are still some politicians, like independent Bernie Sanders, and a few in the Democratic party who are willing to fulfill their missions as public servants. 

If we have any hope, it lies in these Pols.


Michigan Primary Results

Mitt Romney won the Michigan Republican primary yesterday by a margin of 41.1% to 37.9%, the remainder going to the rest of the overpopulated field - Herman Cain, Jon Huntsman and others were on the ballot.  Romney and Santorum each gained 11 delegates.

This Huffpo article has an interactive map showing results by county.

The spread in the results is interesting.  Along the west coast of the Lower Peninsula is Michigan's bible belt.  Santorum carried most of those counties by Margins of 10 to 20%.  Kent county, which contains the city of Grand Rapids, it the exception.  Santorum won that county by only 42.4% to 40.3%.  This illustrates the other part of the Michigan dynamic.  Romney did better in urban areas, while Santorum did better in places where cows or deer outnumber the people. Santorum won many more counties, but lost the total vote count.

This population effect shows up in the victory margins of the counties that Romney won.  In the 5 by 2 band of counties that Romney won in the southern part of the state, Romney's take generally decreases while Santorum's generally increases as you move west.  Then, when you reach the bible belt, it flips to Santorum.  Along the Ohio border is a band of sparsely populated counties that Santorum swept.  Monroe, Lenawee and Branch counties have towns of significant size in them, and in those counties Romney did better by a couple of percentage points.

Ron Paul got between 10 and 12% of the vote almost everywhere. This illustrates something about the modern Republican party.  It is an unholy alliance of far-right Christian fundamentalists, pro-business (pseudo-fiscal) conservatives and libertarians - and the cracks are starting to show.  If nothing else, the endless campaign of Republican debates has cast these differences into bold relief.

Logically, the fundamentalists and libertarians should hold each other in contempt.  The libertarians and the pro-business faction can agree on many things, but not isolationism and the gold standard.  To the business crowd, the fundamentalists are prey.

For decades, the Republicans have drawn the religious right into their fold with emotional hot button issues that have very little actual relevance, like abortion and gay marriage.  The recent campaign against birth control has been an over-reach that is finally causing a back-lash.

In my dreams, the Republican party tears itself apart, and becomes a marginalized political minority.  The Michigan results give me hope that this dream might become reality.

H/T to the LW

Cross posted at AB

Tuesday, February 28, 2012

Deep Stupid # 22 The Social Security Ponzi Scheme

I don't get a lot of idiotic right wing hate mail, possibly because I tend to do this when it happens.

But, sadly, I got one recently from a family member.  Here is the full text, mostly in its original formatting.  The whole thing was in the large font of the title, but I scaled that back down to a more normal size.

____________________________________________

  SOCIAL SECURITY NOW CALLED 'FEDERAL BENEFIT PAYMENT'/ENTITLEMENT!
             
    Have you noticed, your Social Security check is now referred to as a "federal benefit payment"?
    I'll be part of the one percent, to forward this, our government gets away with way too much in all areas of our lives, while they live lavishly on their grossly overpaid incomes! KEEP passing THIS AROUND UNTIL EVERY ONE HAS READ IT.....
    SOMETHING TO THINK ABOUT THE ONLY THING WRONG WITH THIS CALCULATION IS THEY FORGOT TO FIGURE IN THE PEOPLE WHO DIED BEFORE THEY COLLECTED THEIR SOCIAL SECURITY!!!! WHERE DID THAT MONEY GO?????????????
    This was sent to me, I am forwarding it because it does touch a nerve in me.
    This is another example of what Rick Perry called "TREASON in high places" !!! Get angry and pass this on!
    Remember, not only did you contribute to Social Security but your employer did too. It totaled 15% of your income before taxes. If you averaged only $30K over your working life, that's close to $220,500.
    If you calculate the future value of $4,500 per year (yours & your employer's contribution) at a simple 5% (less than what the government pays on the money that it borrows), after 49 years of working you'd have $892,919.98.
    If you took out only 3% per year, you'd receive $26,787.60 per year and it would last better than 30 years (until you're 95 if you retire at age 65) and that's with no interest paid on that final amount on deposit! If you bought an annuity and it paid 4% per year, you'd have a lifetime income of $2,976.40 per month.
    The folks in Washington have pulled off a bigger Ponzi scheme than Bernie Madhoff ever had.
    
Entitlement my ass, I paid cash for my social security insurance!!!! Just because they borrowed the money, doesn't make my benefits some kind of charity or handout!!
    Congressional benefits ---- free healthcare, outrageous retirement packages, 67 paid holidays, three weeks paid vacation, unlimited paid sick days, now that's welfare, and they have the nerve to call my social security retirement entitlements?
    We're "broke" and can't help our own Seniors, Veterans, Orphans, Homeless.
    In the last months we have provided aid to Haiti , Chile , and Turkey . And now Pakistan ......home of bin Laden. Literally, BILLIONS of DOLLARS!!!
    Our retired seniors living on a 'fixed income' receive no aid nor do they get any breaks while our government and religious organizations pour Hundreds of Billions of $$$$$$'s and Tons of Food to Foreign Countries!
    They call Social Security and Medicare an entitlement even though most of us have been paying for it all our working lives and now when it’s time for us to collect, the government is running out of money. 
Why did the government borrow from it in the first place? Imagine if the *GOVERNMENT* gave 'US' the same support they give to other countries.
    Sad isn't it?
    99% of people won't have the guts to forward this.
    I'm one of the 1% -- I Just Did.

__________________________________ 

My response:

Sunday, February 26, 2012

Sunday Music Blogging

Presidential Pipes


Show Business and politics.


This is from over 40 years ago, and still amazingly topical.  What strikes me - and I clearly remember this from a decade before the disastrous Reagan presidency - is that the simple minded actor who went on to become St. Ronnie of Taxcuttia was at that time considered to be a joke.


Saturday, February 25, 2012

Dire Prediction

I suspect that whichever party wins the presidency will also win control of congress.

Every Rethug candidate we've seen is either stupid, bat-shit crazy, totally lacking in character, integrity and moral fiber, or all of the above.  (I leave it as a very easy exercise for the interested reader to figure out who fits in what category.)

If a Rethug wins, it will bring the final curtain down on the American dream.

We will invade Iran.

Petroleum will rise to $200/barrel.

Gasoline will be . . . what - maybe $8/gallon.

There will be a world-wide depression.

This will lead, within a decade, to one or more of these tragic outcomes:
      -  WW III
      -  Dictatorship in America
      -  Blood in the streets

We are staring disaster in the face, and the only things between us and it are Presnent Hopey-Changey and the lame-ass Democratic party


Friday, February 24, 2012

Mijn Nieuwe Armband

Dan niet euthanaseren me!

Mitt Romney on Social Media

"I like being able to delete people from my friends list."


OK.  I made it up.  But, still  .  .  .

What the Hell?!? Friday - Do Not Try to Out-Geek Theo Gray

Theo Gray and His Periodic Table Table.


Source.

H/T to Howeird.

Thursday, February 23, 2012

Is America Losing Its Drive? - Pt. 3 Vehicles per 1000 Persons

In private communication, Roger Chittum got me thinking about the vehicle component of gasoline consumption. I'm going focus on the gross vehicle numbers, and not get too deeply into the car/truck/SUV product mix detail.   Data is from the Department of Energy TRANSPORTATION ENERGY DATA BOOK: EDITION 30—2011.   (Warning:  414 page pdf.)

According to Table 3-5 on page 3-9, vehicle ownership, measured as vehicles (both cars and trucks) per 1000 population, peaked in 2007 at 843.57, and dropped by 1.88% to 828.04 in 2009, two years later.  Data presented in the source is from 1900 to 2009.  This graph shows the data from 1950 to 2009.  Recessions are highlighted in red.


During the post WW II era up to 1982, recessions might have slowed the growth of vehicle ownership, but they did not cause a decline.  Even the severe recession of 1958 only caused a flat spot on the curve.


This changed with the double dip recessions of 1980 to 1982.


The reduction from 1981 to '82 is miniscule.  But since then, every recession has led to a significant reduction from the previous year.  As an aside, this is one more time series that shows a change in character right around 1980.


This source indicates the most recent value for the U.S. is 765, though it's not clear what "most recent" means.  If this is accurate, then ownership has back-tracked to the 1994 level.   This would correspond to a 7.6% drop from 2009, and an astounding 9.3% drop from the 2007 peak.  I don't believe it; but that value is indicated with a red dot on the next graph, as a point of reference.

I've also included some best fit straight lines to show how the slope has changed over time.  The decreasing slope and more serious response to recessions might result from a market being close to saturation, but that's just a guess.


One of the reasons I'm skeptical of the red dot point is that new vehicle sales have recovered substantially from the 2009 low, as this graph from Calculated Risk demonstrates.  (The August, 2009 spike is the cash for clunkers event.)


This might not be enough to stop a continuing slide in the vehicles per 1000 population number, but I think it's enough to keep it from falling off a cliff.

Another perspective on vehicle use comes from Table 3.3 on page 3-5 of the Data Book.  This graph shows the Federal Highway Administration estimate of vehicles in use.


Except for recessions (highlighted in red on the total line) growth of the total vehicle count has been been quite constant over four decades.  But, since the mid 80's, car sales have been stagnant.  All of the growth since then has come from truck sales.  It will be interesting to see how these trends develop over the next few years.

Part 2
Part 1
Cross posted at Angry Bear

Quote of the Day

.   .   .   candidates on one side are contesting for the same base and working to outdo themselves in fealty to a narrow agenda.   Once that question is settled, the winning side will have to address the shared problems of the population. Even if the rhetoric doesn't show dramatic change, actions may well speak louder.
--- Dana Blankenhorn

You might think Mr. Blankenhorn is referring to the clown parade posing as the Rethug slate of prezdent wannabes.  But, no - his Seeking Alpha article  talks about a totally different situation on the other side of the world.

The Bizarro world of Rethug politics has a weird, also religioulsly motivated, image in the fun house mirror of radical Islam.

Somehow, I'm not surprised.

Wednesday, February 22, 2012

A Short Look at Vehicle Miles Driven

Doug Short digs into the same traffic volume data I looked at here.

He digs deeper and goes further, looking at miles driven per capita.

It's an interesting idea that I think has a lot of merit.

Check it out.

Bonus Links:

Here's Hale Stewart on the decline in gasoline deliveries.

Here is a convincing argument that demographics are a major part of the decline.

If I weren't so tired, this would probably make my head explode.

Best Gasoline Delivery Metric

Deliveries by Prime Supplier


Source.

Table of Details.

Roger Chittum did the leg work tracking this down.


Notorious

Seeking Alpha picked up my Drive post from AB

AB gets 7 to 10 thousand views per day, compared to the 50 to 100 I get here.*

SA is in the tens of thousands per day, at least.

Drive 2 was linked by Calculated Risk, a prominent econ blog.

I am become Notorious.

___________________________________
 * A distressing number of whom are from foreigners looking for naked pictures of Sienna Miller.


Tuesday, February 21, 2012

Has America Lost its Drive? Part 2

I made a mistake in my original post  (Cross-posted here at RB.)   Graph 4 in that post was based on the wrong data set.  As Roger Chittum pointed out in comments at AB, that graph only covers a subset of total gasoline deliveries.

This is the correct graph.  (Source.)  Thanks, Roger!


Graph 1 Gasoline Supplied

The fall off in gasoline delivery is not as extreme as I indicated, but it is still real.  Here is a close-up view of data for the current century, from the same source.


Graph 2 Gasoline Supplied This Century

Seasonal changes are dramatic.  Peaks occur in July or August, valleys in January or February of most years.  May values, highlighted with blue dots, and September values, highlighted with yellow dots, are recurring secondary peaks and valleys, respectively.  July values are highlighted with red dots.  The years 2008 and 2010 are accented with contrasting blue line segments.

In 2008, gasoline consumption dropped dramatically.  May was down slightly, compared to '07, while July and September were down a lot.  Through 2009 and '10 there was a slight recovery, with all three highlighted months showing increases.  The 12 month moving average, in pink, stopped falling, but failed to increase very much.

Monday, February 20, 2012

Quote of the Day - Carbon

The most affordable and politically possible way to deal with coal may be to buy the mines and turn them into parks because anything else that comes close to making coal uneconomical will result in massive, protracted litigation about compensation for a "regulatory taking." The whole legislative conversation about markets, offsets (preserving rain forests, etc.), and carbon capture and sequestration ("CCS") grows out of the fantasy that we can achieve adequate CO2 emissions reductions without shutting down all coal mines and closing many refineries. We can't. Deal with it.
Roger Chittum

Roger's reality-based views are always worth a read.  Check it out.

Friday, February 17, 2012

Elliott and Me

Earlier this evening, just before Bill Maher's program came on, while Pavel Datsuyk was slipping the puck past Predator's goalie Pekka Rinne to secure a 2-1 Wings victory 5.8 seconds before the final buzzer, I left this comment at Johnathon Bernstein's blog.

I see the current Republican party as an unholy alliance that has to come unzipped. What natural allegiance is there between Santorum-style social regressives and Romney-style big-business conservatives? The latter can line up with the Libertarians on a lot economic issues, but not on isolationism and the gold standard. The former and Libertatians should logically hold each other in contempt.

How the tea-party slices across this is anybody's guess, since they make no sense, even in their own context.

The Santorum surge shows how deeply the party establishment is out of touch with its base.

I think the country really needs a rational conservative element - which we have not had in decades.  It's really tragic that what we have is a clown parade.

Cheers!
JzB

I was quite pleased to see Bill's guest Elliott Spizer make pretty much this same point (except for my final paragraph) early in the panel discussion.


What the Hell?!? Friday - Vocabulary

Sometimes I get confused by similar sounding words, like defalcation and . . . well, never mind.

So, to help avoid that kind of problem, here is clarification on today's pair of near-homophones (not to be confused with, frex, Rick Santorum.)

Predator (n) An animal that eats other animals.

Predater (n) Someone who knew (so to speak) your significant other before you did.

Has America Lost it's Drive?

Yesterday,  Karl Smith posted on Oil and the Structural Recession.  This seems to be one of Karl's thinking-out-loud posts, with more questions than answers, some convoluted reasoning, and a conclusion that higher gasoline prices are in our future.  If I read him right, this will be due to a demand pull.

He included this graph from Calculated Risk.


Graph 1.  U.S. Vehicle Miles

The number of miles driven tends to flatten during a recession, then recover quickly when the recession is over.  At least, that's the way it used to be.  The Miles Driven curve seems to have been losing slope since the late 90's, and was close to flat-line during the housing bubble last decade, when everyone supposedly felt rich.  There has been no recovery after the recent Great Recession, which officially ended 32 months ago.

 The same CR post cited above also includes this graph.


Graph 2.  YoY Change in Vehicle Miles

This confirms my eye-ball assessment that the slope in the first graph has been in decline since long before the oil price bubble of recent years.

But here is a contrary development.  Calculated Risk also reports that the truck tonnage index is way up for all of 2011, and especially in December, when it posted an all time high.


Graph 3. Truck Tonnage Index

Truck traffic is way up, but total miles driven, per graph 2, has been mostly in decline for four years.

This suggests that discretionary personal driving has been sharply curtailed.  I'm having a hard time coming up with any alternative explanation.  Can anybody suggest one?

Just in the last couple of months, it seems that discretionary driving has taken a deep plunge that has not yet shown up in the data posted above.  Deliveries to retail gas stations have been slumping for well over a decade, and now have fallen off a cliff.  If gasoline delivery is just-in-time, as I believe it is, then deliveries are an excellent proxy for consumption.

By the Way, improved fuel economy cannot account for more than a small fraction of this change.  The big improvements in fuel economy happened during the 80's, when fuel deliveries were in an upswing.  Since 1990, fuel economy improvements for the actual fleet on the road have been on the order of 0.5% per year.


 Graph 4.  Gasoline Retail Deliveries

I made my own graphs of the retail delivery data (not posted,) and there is, surprisingly, no particular response to the recessions of 1991 and 2001.  It's not easy to find any recession on Graph 4.  Deliveries were slumping even before the Great Recession, so whatever effect it might have had on its own was subsumed by the general trend.  The above graph is noisy, due to lack of seasonal adjustment.  The lowest row of dots over most of this graph represents January data.  Summer months cluster at the top of the array, as you would expect.  Those two lonely points in the lower right corner are October and November, 2011, the most recent data shown.

It's remarkable that gasoline deliveries are now substantially lower than at any time available in this data set. spanning about 30 years.  And I would never have guessed that anything like this was happening, based on my many trips on I-75 between Detroit and Toledo.  That route must not be a representative sample.

In a comment on Karl's post, I said that I see all petroleum prices as highly manipulated on the supply side, with demand as a follower.  This data makes me think that the same is true of gasoline, in particular.  But it can't be the entire story for the decline in consumption.  There is no clear connection between deliveries and gasoline prices over the last several years.

I don't know where gasoline prices are going.  Karl might be right that they are going up.  But I don't see any way that this can be due to a demand pull.

Mish also has a couple of recent posts relevant to this topic.

H/T to commentor rjs at Karl's post, who got me thinking about this, and provided a key link.

Cross-posted at Angry Bear.

Update:  This post got picked up by Seeking Alpha.

Wednesday, February 15, 2012

Tuesday, February 14, 2012

What Fergie Wore

I have no concern for pop culture, do not watch award shows, and am utterly indifferent to the clothing styles of celebrities, with the possible exception of their occasional transient amusement value.  That said, I saw "Fergie's Risky Grammy Dress" in the side bar at Huff-Po while reading something else, and thought I'd check it out.  Who knows, risky might imply risque, and, like most guys, I'm a voyeur at heart.

Some observations:
Fergie (about whom I know nothing) is quite an attractive and very fit looking lady.
The dress, itself, is actually quite beautiful.
Though the cut of the dress is modest, you can see her underwear, because it is also, for all intents and purposes, transparent.
Hence,  the view of it is controversial.

Some thoughts:
 I guess being able to see underwear is the controversy, and with this dress is pretty much the point.
The underwear is actually modest, either as underwear goes, or by beach attire standards.
The dark color of the underwear accomplished a few things:
     - OMG - you can see her underwear!
     - Which makes it obvious that she is wearing underwear - not always a foregone conclusion
     - By contrasting so starkly with both the dress and Fergie's skin tone, the underwear becomes the focus.

So why focus on underwear?  My guess it's so that people will say, "OMG - you can see her underwear!"  This could have been avoided, to an extent, by color matching the underwear to the dress. I'm having a hard time visualizing that, and suspect the over-all effect would have been a downgrade, all things considered.  Another approach, probably more pleasing from a purely aesthetic PoV,  would have been to color-match the underwear to Fergie's skin tone.  That would have sent the controversy down a totally different track, though.

My evaluation: for style and aesthetics, on balance, a fail, but not an epic fail.   For getting people to sit up and take notice,  a rather spectacular success.


Quote of the Day

Paul Krugman:

Nobody — not William Julius Wilson, not Larry Mishel, not yours truly — denies that the bad effects of reduced opportunity would be much less if people always did what was in their best long-term interests. But people often don’t, which is why loss of economic opportunity can be socially as well as economically destructive. That’s not crude materialism, it’s saying that people are human.

Emphasis added.

 I just want to point out PK's implicit denial that people are 1) utility enhancing agents, 2) forward thinking, and 3) perfectly rational.

Of course, people who do believe these things also claim Krugman is an idiot.  Go figure.

That is all.


Sunday, February 12, 2012

I Am Not Rational

At least by this assessment:

If the theories of economists are harmful to the general welfare, why doesn’t someone try to persuade the public that these theories are mistaken? 

Collective action in this sense is infeasible. If we instead consider the efforts of a single individual, the cost in terms of time and effort of discrediting an economic theory is substantial, while the benefits are dispersed over many people and so are comparatively small. In any case, the efforts of one person are unlikely to be decisive in swinging the consensus of economists away from a given erroneous theory. It follows logically that the rational decision for an intellectual consumer is to be inactive on this front, and even to be ignorant of the flaws in economic theory.

Quotes of the day - Markets

Actual markets in the American economy are extremely rare and unusual beasts. An economics of markets ought to be regarded as generally useful as a biology of cephalopods, amid the living world of bones and shells. But, somehow the idealized, metaphoric market is substituted as an analytic mask, laid across a vast variety of economic relations and relationships, obscuring every important feature of what actually is. And, then we wonder why the “thinking” and policy debates that result are stupid and corrupt.
---  Bruce Wilder

Emphasis added.   This is in the context of a critique of neoloberalism, here described by Henry Farrell:

In fact, it is not free markets with vigorous competition among producers, but instead, a mixture of big firm oligopoly and cosy and frequently corrupt relationships between state officials, who have been told to subcontract out parts of government, and the businesses which supply these new services, in what is at best a murky approximation to a real marketplace. You can read this as a statement that classical liberalism has some good points as well as some bad ones. You can equally well read it as saying (and this is the more fundamental point), that regardless of whether or not classical realism had some good arguments, these don’t have anything much to do with actually-existing-neoliberalism which is a crony capitalist fantasy.

This lays bare the greed, dishonesty, corruption and manipulation inherent to neoliberalism, and simultaneously exposes the concept of "the market" as an absurd quirk of the typical economist's imagination.

Each of these meaty comments is highly worthy of  QoD recognition.  The cephalopod reference made the first one utterly irresistible, and prompted this post.

The bad news is that there doesn't seem to be any way out.

H/T to Unlearningecon

Update:  Here, John Quiggan provides a good functional definition of neolibealism - the first I've ever seen - and a very thoughtful critique of neoliberalism as a political cum economic ideology.

The core of the neoliberal program is
(i) to remove the state altogether from ‘non-core’ functions such as the provision of infrastructure services
(ii) to minimise the state role in core functions (health, education, income security) through contracting out, voucher schemes and so on
(iii) to reject redistribution of income except insofar as it is implied by the provision of a basic ‘safety net’.

Quiggan judges neoliberaism to be a failure, for different reasons in different places.  I'm going to quibble with his definition of failure, type iii, though: a failure to deliver the promised outcomes.  With a focus in the inherent dishonesty and corruption inherent to neoliberalism, I can only view it as highly successful in the U.S.  This is because there is a real hidden agenda lurking behind the false public agenda.
 
Wilder describes how it works in a follow-up comment: (Be sure to read the whole thing.)
Neoliberalism, it seems to me, uses the myth of the market, to rationalize rule-making, which serves the rentiers (is dynamically inefficient) and which promotes authoritarian, and therefore unfair, resolution of conflict.

Quiggan describes the type iii failure in the U.S:  "The basic problem is that, given high levels of inequality, very strong economic performance is required to match the levels of economic security and social services delivered under social democracy even with mediocre growth outcomes."  Of course, no such strong economic performance is forthcoming.

However, the real agenda is not general economic security.  Quite to the contrary, it is to maximize and maintain a high level of inequality, such that the small, elite minority has absolute control over the impoverished majority, precisely because their economic security is severely limited.  I cite as evidence the extreme form of 21st CenturyRepublican party neoliberalism, which even attacks the existence of a basic safety net.  Note also their ongoing attacks against labor unions, health care reform, and education at all levels.

The job is not yet complete, but I have to view the record of neoliberalism in the U.S.,to date, as a smashing success.

Cross-Posted at Angry Bear.

Tuesday, February 7, 2012

What Was America's Golden Age?

In comments at Art's place, Gene Hayward asked both Art and me to describe the characteristics of America's Golden Age.

This was the period following WW II, spanning roughly 1950 through the mid 70's, or perhaps a few years later, when the United States experienced robust GDP growth.  Though this growth was far from consistent, it was on average, considerably higher than what we have been able to achieve since.

I've looked a GDP a lot, and in a lot of different ways.  The tag list low in the right hand frame indicates over 40 posts on this blog tagged GDP.  Here is a fairly recent one with a graphic demonstration of how the Golden Age differed from the Great Moderation Stagnation that followed.  A more detailed graph with historical commentary can be found here.

The most important defining characteristic of the Golden Age is this GDP growth record.  The next questions are what were the causes and the results?

For causes, I would consider:

Steeply Progressive Tax Rates
Strong Unions
Social Safety Net
Growing Income in the Labor Force and an increased Standard of Living

Regulations on Businesses
Particularly the Strong Regulations on Banking and Finance enacted during the Great Depression, and most particularly Glass-Steagall.
Fiscal Policies consistent with Keynesian Economics

Results:

Robust middle class
Relative equality in income and wealth
Sharp reduction in the number of people in poverty
The Strong Economic Growth that characterized the period

One might consider that the results cycle back into the causes creating a virtuous spiral.  That's how I see it.

Another characteristic of this period was secular inflation.  In this environment, a commodity price shock can send inflation soaring, and that happened twice in the 70's.  I distinctly remember some time in '73 or '74 thinking that nobody would ever look back on that time as "the good old days."  Then disco music came along and sealed the deal, but that's another story.

Shortly thereafter, Volker came along and slayed the inflation dragon.  Since then, we have had secular disinflation.  As you can see in the link above, in this environment, commodity price shocks have not caused inflation spikes.

The Reagan administration vigorously continued the deregulation trend started under Carter, and dramatically changed the tax code (lowering tax receipts relative to GDP, and shifting the burden from the rich to the declining middle class.)

Since then - except for Clinton bucking the trend, at least partially - it's been all lower taxes and deregulation.  This has skewed both income and wealth toward those that already have the most.  The result has been the Great Stagnation, and the slow strangulation of the American Economy.

Monday, February 6, 2012

Where Has All The Money Gone, Pt IV - Dividends

Note:  This will go up at Angry Bear Tomorrow morning, so I'm using the numbering system and links to this series at that location.  Originally I posted it here at RB, though in substantially different form, but the data source for my graph has disappeared into the ether.  I rebuilt the graphs using data from the primary source.

We've already seen in previous installments of this series that since about 1980, I, corporate profits have soared, II, the slice of profits going to finance has soared even more, and III, wages have stagnated.  Here we see what corporations have done with all that money.   There is a limited selection set: pay taxes, distribute as dividends, pay down debt, invest, make acquisitions, speculate, and hold as cash.

Here is a look at taxes through 2008 and dividends through 2010, as percentages of profits; data from BEA table 7.16, lines 19, 20 and 38.   For my purposes, profits are divided among taxes, dividends, and all the other things mentioned above, which I'll call the Residual.


Dividends/ Profits are in green; Taxes/Profits in red.  I've added 13 year moving averages to clarify the trends over time.  The Dividend percentage bottomed in 1978 at 20.6%.  I've marked that year on both curves with a yellow dot.  After that, dividend payments took off sharply and have been mostly in the 40 to 50 % range since 1989.  The tax rate on dividends was reduced to 15% in 2003, also marked with a yellow dot, but I don't think that change has had much effect on dividend payout.  The gyrations in the payout percentage since 2003 are largely due to the denominator affect, as profitability increased after the 2001-2 recession, and plummeted during the recent Great Recession.  Notably, 2010 profits are the highest ever. 
 
The tax payout drop lagged the dividend increase by several years, and didn't start dropping until 1987.   In 1986, the tax payout rate was 45.2%.  After a sharp drop to 27.7% in 1992, the payout rate increased throughout the Clinton administration, topping at 34.5% in 2000.  Then, there was another sharp drop.  It has since leveled off, averaging 25% since 2004.

In 1978, the 13 year averages were 24.2% for dividends and 42.4% for taxes.  Those averages are now 28.3, and dropping; and 45.7 and rising, respectively  45.7 and rising for dividends; and 28.3% and dropping for taxes - essentially a reversal of positions.  The net result is a massive funneling of money from government to dividend recipients who now are paying only 15% tax on their dividend income.

This is not only "Starve the Beast" in action, it is a massive redistribution of wealth into the hands of those who already have the most.   Say what you will about the relative efficiencies of the private and public sectors in using resources, the public sector places money into the hands of people who will spend it and keep the economy moving.  The private sector largely funnels it into rent seeking.

For the sake of completeness, here is a look at the Residual - as defined above - with a 13 year moving average and a best fit straight trend line.


This provides a partial explanation for Jon Hammond's observation that net corporate investment has been down over the duration.  There is less residual to invest.

Bottom line:  Corporate profits have been skewed to dividend payments, to the detriment of worker salaries, government tax revenues, and corporate investment.

Update:  Cross posted at Angry Bear.

Quote of the Day

To me, the Giants out-adequated the Patriots.
                                    - Njorl, commenting at LGM


Halftime in America

This is a great ad, but Clint Eastwood strikes me as being a wildly inappropriate spokesperson.


But maybe it's just me.

Sunday, February 5, 2012

Pffootbawl!

Revisiting the 1920-21 Depression

I've looked a this before, here, here, here, here, and here.

I am very happy to see my take validated, and the Austrian case rebutted by David Glasner.  He links to a short, fact-filled Journal article by David Kuehn that totally blows up the Austrian case that the 1920-21 event refutes the Keynesian approach of the 30's.

To summarize -

-  The Austrians have the historical facts wrong about 1920-21.
-  The 1920-21 depression was a supply-induced event, while the 1929-on depression was an aggregate demand shortfall event, as was the 2008-on Great Recession.
-  Fundamentally different problems arising in fundamentally different circumstances call for fundamentally different policy solutions.

Glasner and Keuhn are both very polite and circumspect in their treatment of Austrians, so for just this once, I will be, too.


Friday, February 3, 2012

What the Hell?!? Friday - "Hell"

Hell is an invention by those who belong there to keep us from exacting justice upon them in this world. 

- Bad Tux the Snarky, Cynical Penguin  


See here for more What the Hell?!?  Hell.


Thursday, February 2, 2012

Income and Consumption

This is another look at the idea I put forth here, that - contra the standard economic idea that consumption depends on wealth - I believe that consumption depends on income.  It's worth stressing that wealth and income are not independent variables.  Wealth is the accumulation of unspent income plus returns generated on that wealth over time.  Is it proper to say that wealth is a stock, and income is a flow? 

I believe the evidence very strongly indicates that consumption - also a flow - is tied tightly and directly to income.  This does not mean that wealth cannot play a part in consumption decisions.  People make all kinds of decisions about all kinds of things, for all kinds of reasons.  But consumption decisions are constrained, and there is no reason why they can't be constrained in more than one way. 

I think the idea that consumption depends primarily on wealth is intuitively weak because consumption is aggregated over the population, while wealth is concentrated in a small segment of that population.  A person with little or no wealth will spend the next dollar meeting some unsatisfied need, while the person with lots of wealth has the option of devoting it to rent-seeking or accumulation in an off-shore shelter.  According to data now more than a decade old, the richest 1% of households owned 38% of all the wealth; the top 5% owned over half, and the top 20% owned over 80% of the wealth.  The trend towards rising inequality started in the mid 70's.

A couple of proxies for wealth are home and common stock ownership.  Excluding home-ownership, the wealth concentration is even more extreme, with the top 1% owning 50% of the non-home wealth.  It's difficult to determine the actual amount of stock ownership in private hands.  A number arrived at by elimination leaves 36% among households, non-profits, endowments and hedge funds.   Therefore, realistically, the bottom 99% of individuals share about 18% of all stocks with those other institutions.  At the bottom end, the lowest 20% have either no wealth, or negative net worth.

People at the low end live close to subsistence.  People in the middle live pay check to pay check.  For the vast majority of the population, the next marginal dollar has a high probability of being used as a consumption expense. 

That is my narrative to support the idea that consumption must necessarily be strongly dependent on income.  Now, let's look at some data, through 2009, from the U.S. Census Bureau, Table 678.  The first graph shows Disposible Income (green) and personal Consumption Expenditures (red) back to 1929.


A careful look suggests a narrative about this relationship.  First, consider the depression years.  From 1932 to '34, consumption averaged 99% of disposable income.  People had needs, and used their limited incomes to satisfy them, as best they could.   Then, during WW II, with rationing and other constraints, saving was forced, and consumption was artificially low.  Consumption reached an all-time low of 73.3% of Disposable Income in 1944.  Since shortly after WW II, changes in Disposable Income and Consumption have been in virtual lock-step.   I've put lines in a contrasting color connecting selected points in the Disposable Income curve, and dropped parallel lines for the same years onto the Consumption curve.  Since 1951, very wiggle in Income corresponds to a wiggle in Consumption.

Here is a scattergram of the two subject variables, with a best-fit straight line provided by Excel.


As has been pointed out to me, correlation is not causation.  But - when one can construct a rational narrative that explains the data, the two series display absolutely congruous motion over several decades, and R^2 is over 0.99, I'm willing to go out on a limb and say the burden of proof is on the denialists.

Here is a look at Consumption as a percentage of Disposable Income, since 1951.


I've expanded the Y-axis.  In a view of the entire 0 to 100% scale, the post-1950 line barely wiggles.  Over a span of 6 decades, Personal Consumption has averaged 90.1% of Disposable Income, with a standard deviation of 2.12%. 

The data points, average, and an envelope one Std Dev above and below the average are all displayed on the graph.  Despite having two clearly defined and opposite tending trends, this is still a well behaved data set, with 39 of 58 (67%) of the points within the envelope.

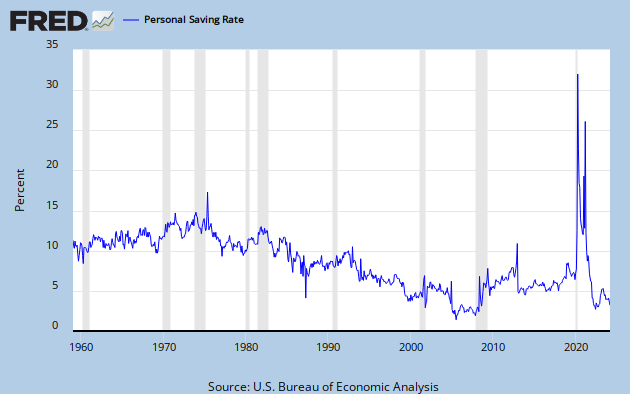
The two minima are in 1982 and 1984, and the bottom trend lines converge in 1982, so that is a reasonable time to define as the break point.  This also suggests a narrative.  During the post WW II golden age, typical wage earners moved incrementally above the subsistence level.  This gave them the opportunity to save a little bit.   Since 1982, as wages stagnated, it became necessary to devote a higher percentage to Consumption.  Sure enough, savings grew through the mid 70's, and have dropped dramatically since 1982, as this FRED graph demonstrates.


I won't say that Consumption Spending is solely dependent on Income.  But I will say that it is strongly, and even predominantly, dependent on income.   Wealth might enter into the decision for those who actually have some, but they are in the minority and have few needs that can be satisfied by the next dollar of consumption.

My conclusion is that the best solution to the aggregate demand shortfall problem is to put money into the hands of the people who will actually spend it, and that the best way to do that is to give them jobs.  As stop-gaps, various relief and welfare programs also have their place. This is the rational for fiscal stimulus.  Federal spending programs provide real jobs for real people, and they will spend their earnings.  Arguing about whether this is hole-filling or pump-priming strikes me as being just about as important as arguing about how many angels can dance on a pin head.

Update:  Cross-posted at Angry Bear

Wednesday, February 1, 2012

Quote of the Day

I never meant to say that the Conservatives are generally stupid. I meant to say that stupid people are generally Conservative. I believe that is so obviously and universally admitted a principle that I hardly think any gentleman will deny it.
- John Stuart Mill